Dry information | Analyzing overshoot and phase margin
▲ For more exciting content, please click the blue words above to follow us!
Second-order systematization of circuits
Some common feedback circuits are usually second-order systems. Let’s discuss the capacitive loading of op amps as an example:
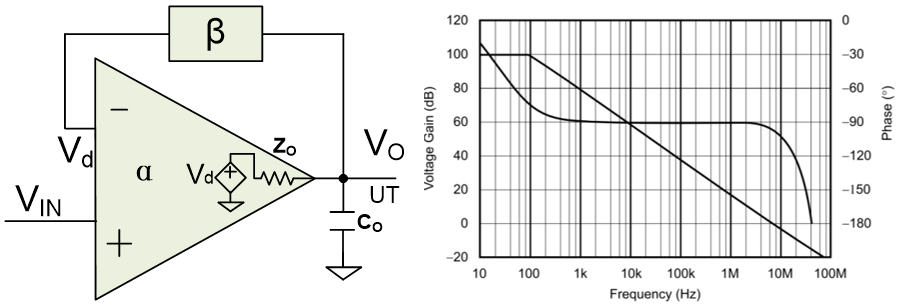
*Capacitive loading of op amp *Open loop gain curve of typical general purpose op amp


Among them, K is the DC open-loop gain of the op amp, and β is the feedback coefficient (when used as a follower, β=1, when amplified 100 times, β=0.01).
1/τa is the angular frequency of the low-frequency main pole of the op amp, and 1/τb is the angular frequency of the parasitic poles generated by Zo and Co. It can be seen that τa>>τb.
The above equation can be converted into a standard second-order system

Since K is the DC open-loop gain of the op amp, Kβ>>1

Among them, ωn is the natural frequency of the circuit, ξ is the damping coefficient, and

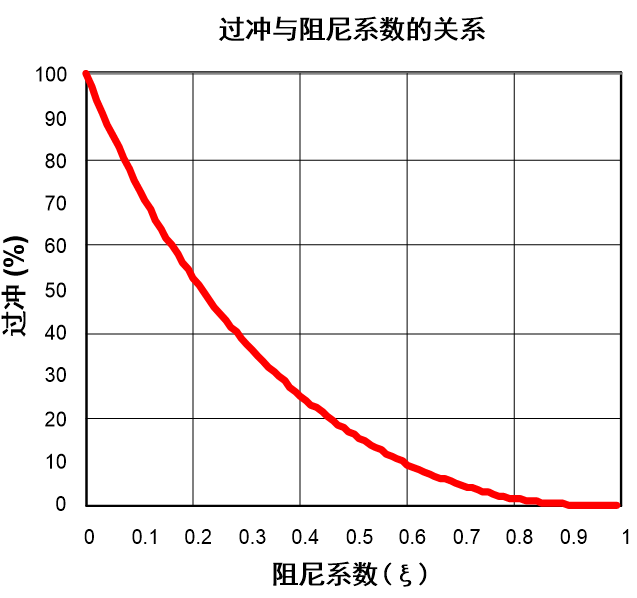
The relationship between time domain overshoot and damping coefficient
We know that overshoot will occur only when the system is in an under-damped state, that is, 0<ξ<1.
For a standard second-order system,

Its unit step response function can be obtained as:

when

Find the time corresponding to the first peak of the step response:

So the overshoot is

Therefore we can draw the following curve of overshoot and damping coefficient
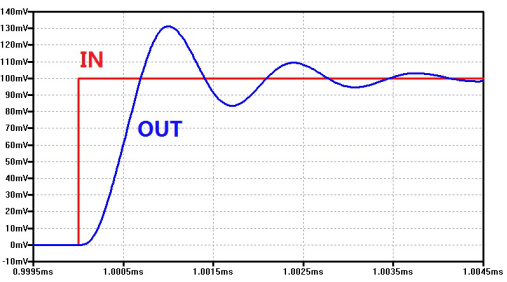
Overshoot can be detected by giving a small step signal at the input and measuring it at the output. The figure below shows the overshoot measured using a 100mV step input at 1ms in a system with ξ=0.35. The overshoot is 31%.
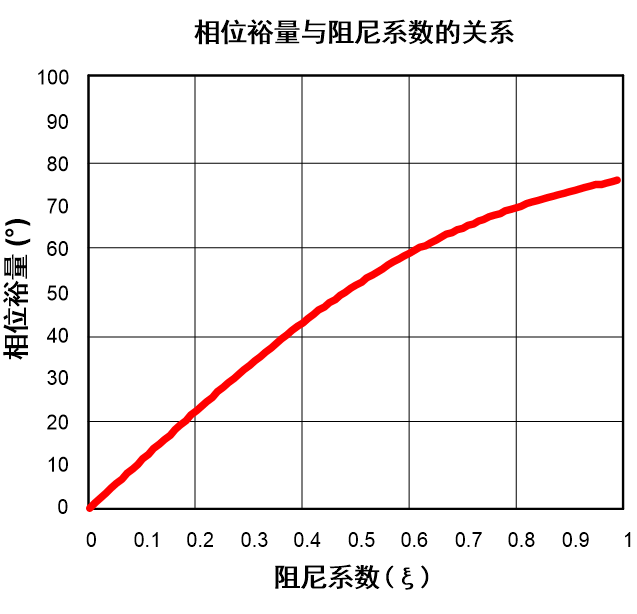
The relationship between phase margin and damping coefficient
Let’s next analyze the relationship between damping coefficient and phase margin (Phase Margin)
The loop gain of the system is:

In order to obtain the system crossover frequency ω c , |A(s)β|=1
seek for

So the phase margin

With this we can draw the following curve of phase margin and damping coefficient
The relationship between phase margin and overshoot
From this, we use the damping coefficient to obtain the relationship between phase margin and overshoot, and draw the curve as follows
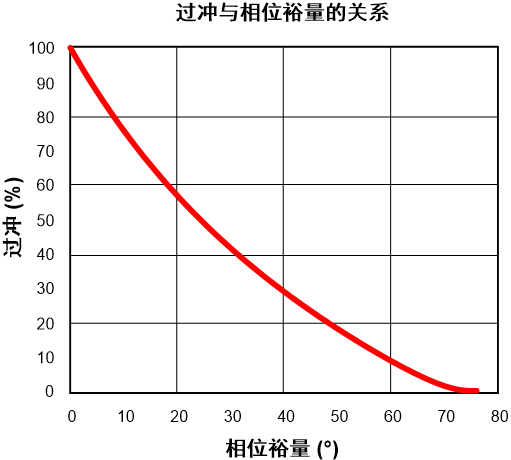
As can be seen from the above figure, when the phase margin is greater than 70˚, there is almost no overshoot.
When the phase margin is 60˚, OS(60˚)≈8.8%
When the phase margin is 45˚, OS(45˚) ≈23.4%
Our discussion is based on a second -order system, so if the actual circuit is not a second-order system, the relationship between phase margin and overshoot will not strictly follow the above inference. But fortunately, most circuits in reality are similar to second-order systems, so the method of judging system stability by observing the overshoot condition (OS) is useful for sometimes system debugging (especially for differential amplifiers or SOCs). etc., where a feedback pin is not provided and a loop analyzer cannot be used), or qualitative analysis is of great benefit.
Source: Sarijie Semiconductor
Recommended reading


 京公网安备 11010802033920号