

Author: CHENG Jian
Link: https://kernel.blog.csdn.net/article/details/68948080
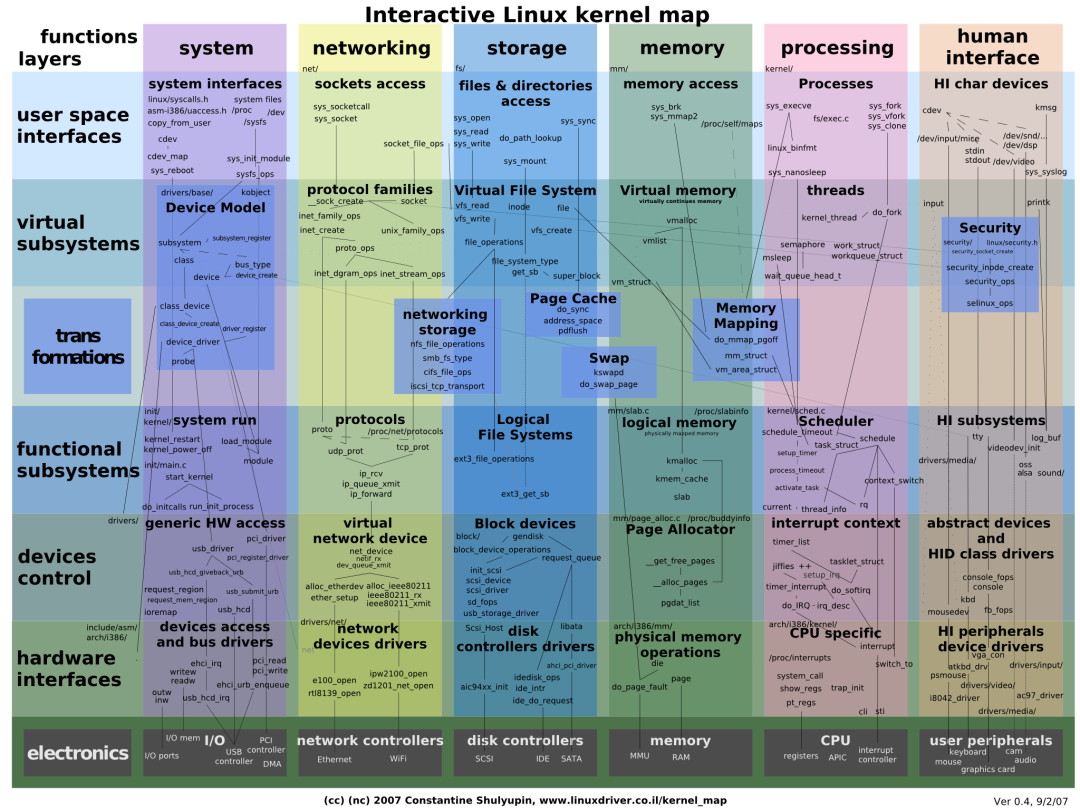
1 Kernel debugging and tool summary
The kernel is always so unpredictable, and the kernel will make mistakes, but debugging is not like user space programs. For this reason, kernel developers provide us with a series of tools and systems to support kernel debugging.
The essence of kernel debugging is the data exchange between kernel space and user space. Kernel developers provide a variety of forms to complete this function.
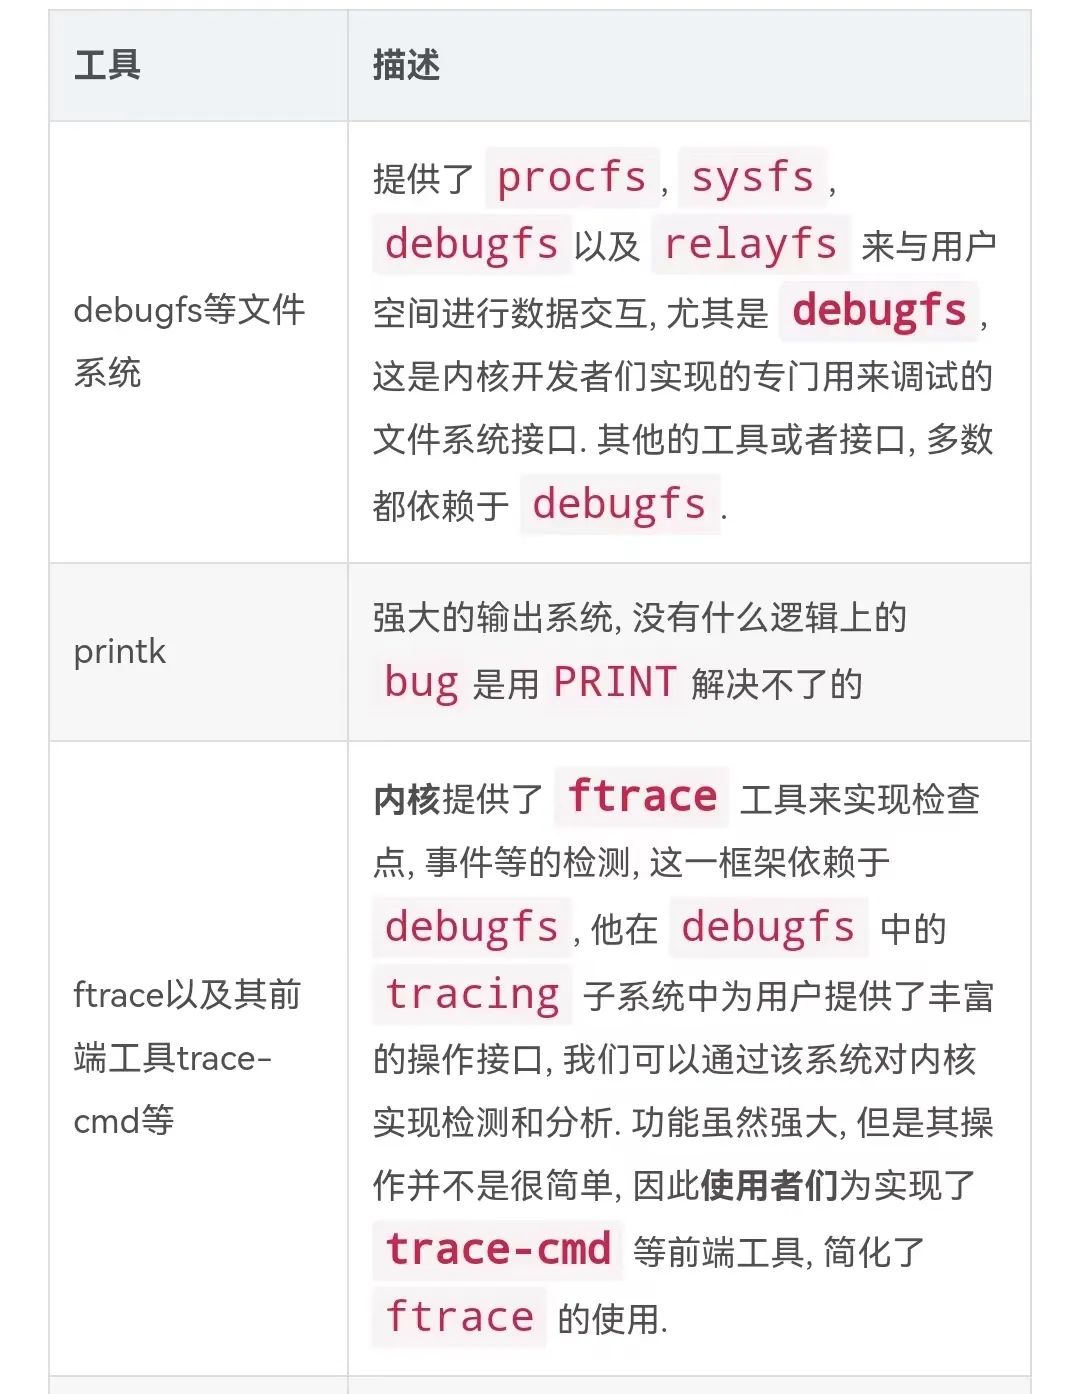
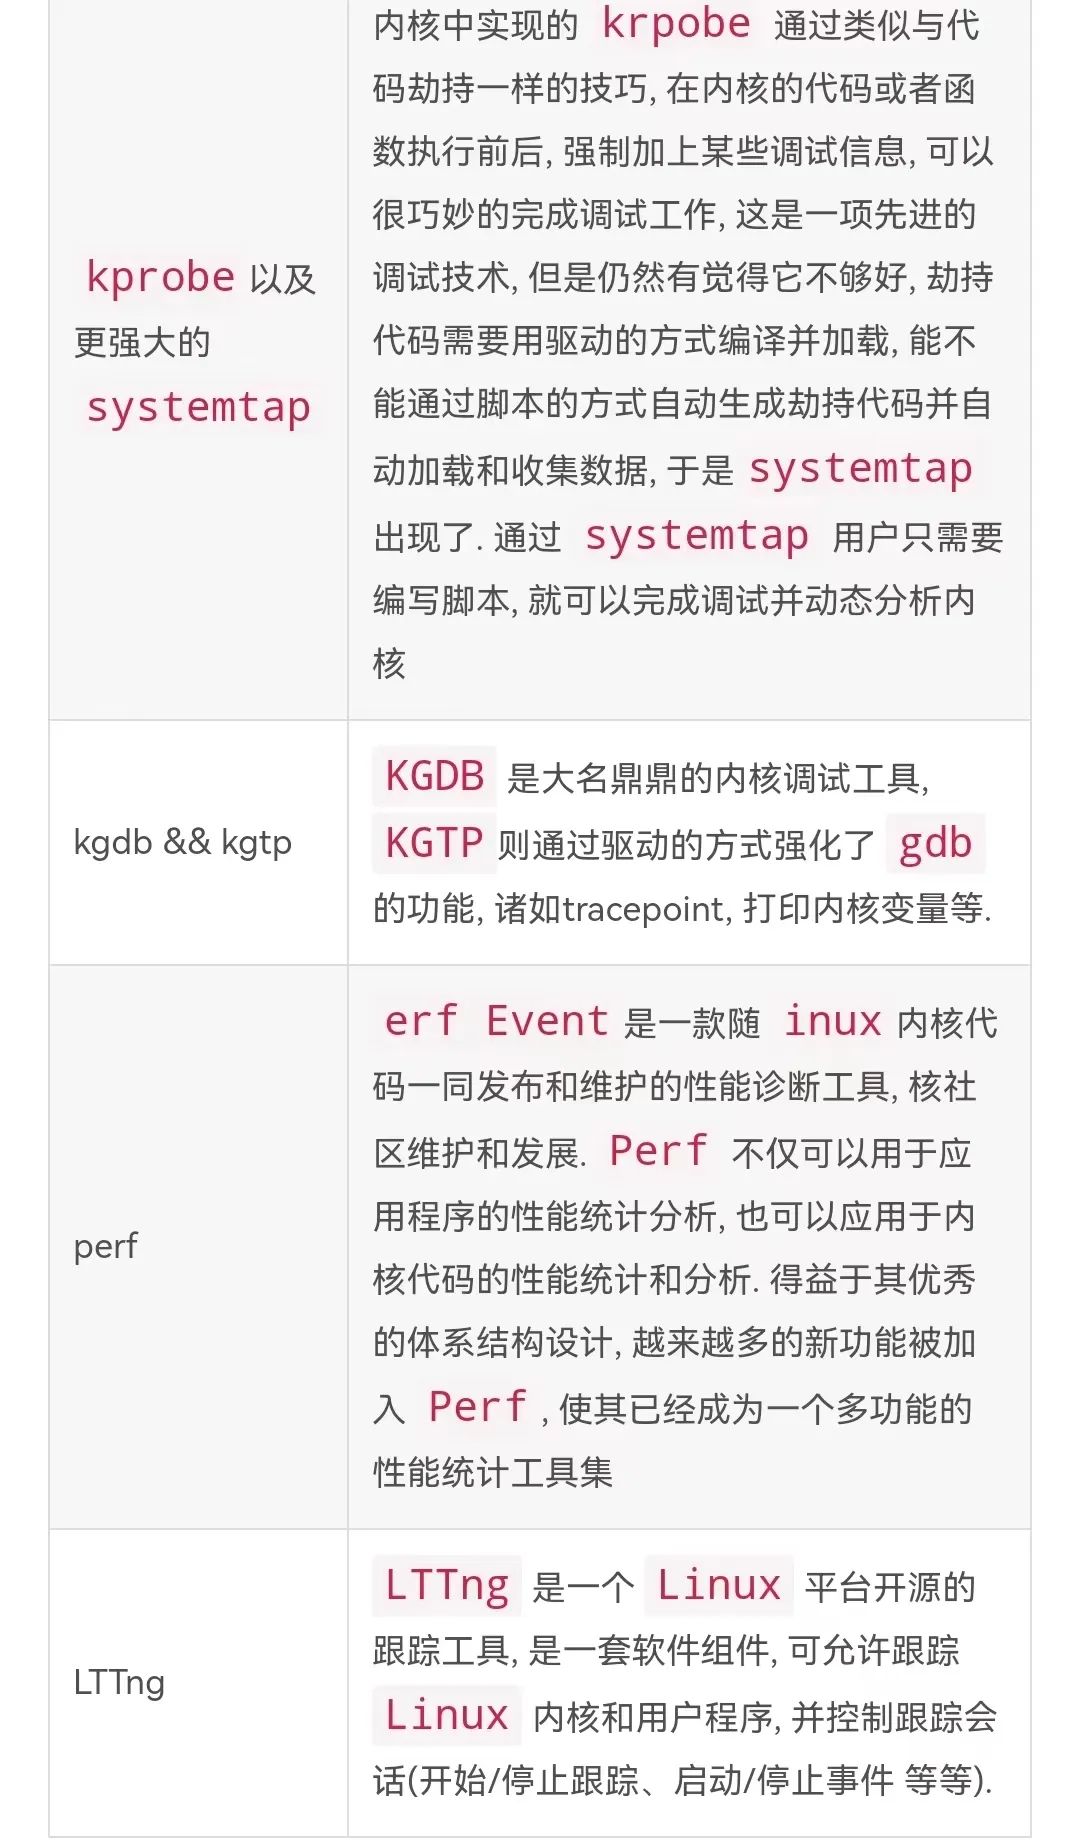
2 File system for data exchange between user space and kernel space
There are three commonly used pseudo file systems in the kernel: procfs, debugfs and sysfs.
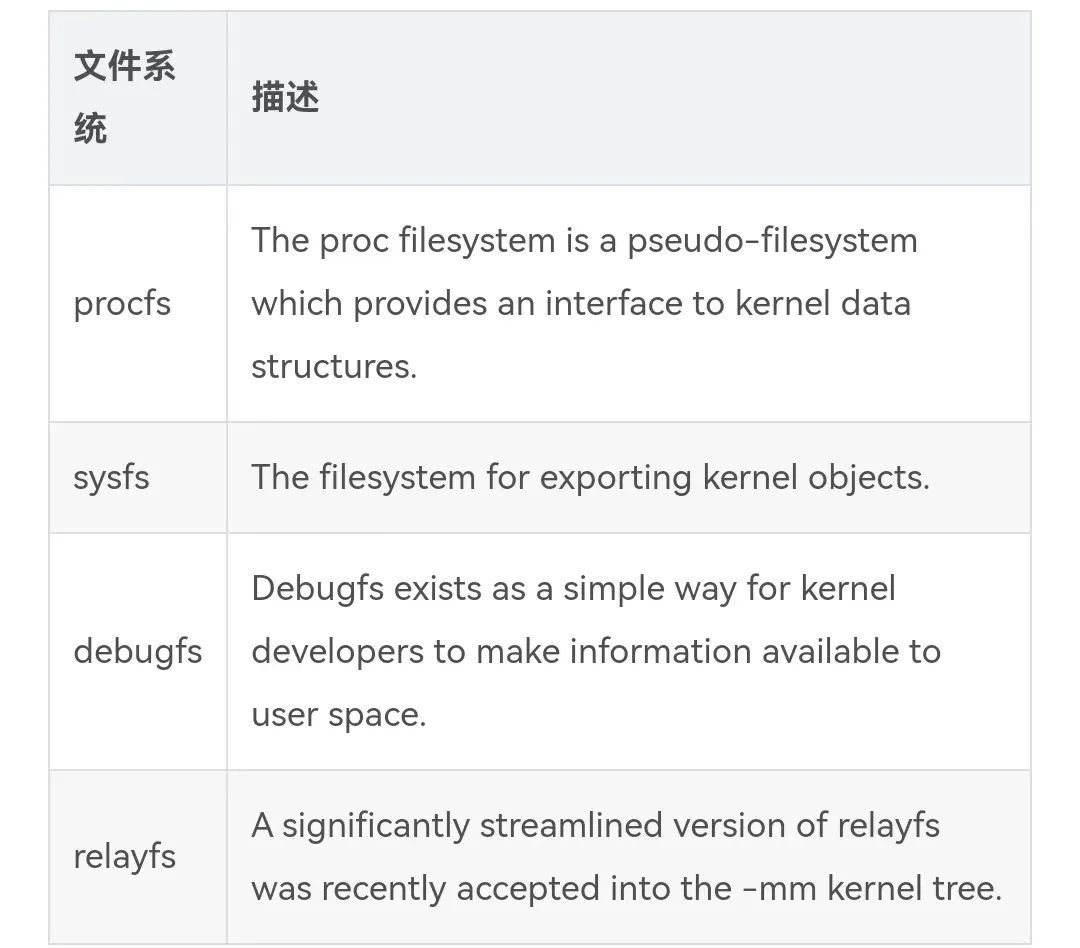
They are both used for data exchange between the Linux kernel and user space, but their applicable scenarios are different:
-
procfs
It has the earliest history and was originally the only way to interact with the kernel to obtain various information such as processors, memory, device drivers, processes, etc.
-
sysfs
It is closely related to
kobject
the framework, but
kobject
it exists for the device driver model, so
sysfs
it serves the device driver.
-
debugfs
Judging from the name, it is
debug
born for , so it is more flexible.
-
relayfs
It is a fast forwarding
(relay)
file system, named after its function. It provides a fast and efficient forwarding mechanism for tools and applications that need to forward large amounts of data from kernel space to user space.
Related links:
How to exchange data between user space and kernel space under Linux, Part 2: procfs, seq_file, debugfs and relayfs: http://www.ibm.com/developerworks/cn/linux/l-kerns-usrs2/
Linux file systems: procfs, sysfs, debugfs Usage: http://www.tinylab.org/show-the-usage-of-procfs-sysfs-debugfs/
2.1 procfs file system
procfs
It is an older way of exchanging data between user mode and kernel mode. Many kernel data are exported to users in this way
, and many kernel parameters are also set by users in this way. Except for
the parameters
sysctl
exported
/proc
to ,
procfs
most kernel parameters are read-only. In fact, many applications rely heavily on procfs, so it is almost
an indispensable component. Several examples in the previous section have actually used it to export kernel data, but they did not explain how to use it. This section will explain how to use it
procfs
.
2.2 sysfs file system
Kernel subsystems or device drivers can be compiled directly into the kernel or compiled into modules. If
compiled into the
kernel, parameters can be passed to them via kernel boot parameters using the method described in the previous section. If compiled into modules, parameters can be passed via the command line when inserting the module, or at runtime, using
sysfs
to set or read module data.
Sysfs
It is a memory-based file system. In fact, it is based on
ramfs
and
sysfs
provides a way to open kernel data structures, their attributes, and the connection between attributes and data structures to user mode. It is
kobject
closely integrated with the subsystem, so
kernel developers do not need to use it directly, but the various subsystems of the kernel use it. If users want to use to
sysfs
read and set kernel parameters, they only need
sysfs
to load to read and set the various parameters opened to users by the kernel through file operation applications
sysfs
:
mkdir -p /sysfsmount -t sysfs sysfs /sysfs
Note that you should not
confuse
sysfs
with
sysctl
.
sysctl
They are some control parameters of the kernel, and their purpose is to facilitate users to control the behavior of the kernel.
sysfs
only
kobject
opens the hierarchical relationship and properties of the kernel's objects to users for viewing, so
most of are read-only. The module
is exported
as a
, and the module parameters are exported as module attributes. The kernel implementer provides a more flexible way to use the module, allowing users to set
the visibility of module parameters in and allowing users
to set the access rights of these parameters under when writing modules
. Then users can
view and set module parameters through , so that users can control module behavior when the module is running.
sysfs
kobject
sysfs
sysfs
sysfs
sysfs
Related links:
How to exchange data between user space and kernel space (6) - module parameters and sysfs: http://www.cnblogs.com/hoys/archive/2011/04/10/2011470.html
2.3 debugfs file system
Kernel developers often need to output some debugging information to user space applications. In a stable system, this debugging information may not be needed at all, but in the development process, in order to understand the behavior of the kernel, debugging information is very necessary. Printk may be the most used, but it
is not the best. Debug information is only used for debugging during development, and
printk
will be output all the time. Therefore, unnecessary
printk
statements need to be cleared after development. In addition, if developers want user space applications to change kernel behavior,
printk
it cannot be achieved.
Therefore, a new mechanism is needed, which is used only when needed, to provide debugging information to user space applications by creating one or more files in a virtual file system when needed.
There are several ways to achieve the above requirements:
-
Use
procfs
, in
/proc
Create a file to output debugging information, but
procfs
For output larger than one memory page (for
x86
is
4K
) it is more troublesome and slow, and sometimes there will be some unexpected problems.
-
Using
sysfs
sysfs
(
2.6
a new virtual file system introduced by the kernel), in many cases, debug information can be stored there, but sysfs is mainly used for system management, and it expects each file to correspond to a kernel variable. It is very difficult to use it to output complex data structures or debug information.
-
Use
libfs
to create a new file system. This method is extremely flexible. Developers can set some rules for the new file system. Using
libfs
makes it easier to create a new file system, but it is still beyond the imagination of a developer.
In order to make it easier for developers to use such a mechanism,
a virtual file system
Greg Kroah-Hartman
was developed
debugfs
(
2.6.11
first introduced in ), which is dedicated to outputting debugging information. The file system is very small and easy to use. You can
choose whether to build it into the kernel when configuring the kernel. If you do not choose it, the kernel part that uses the API it provides does not need to make any changes.
Related links:
The way of exchanging data between user space and kernel space (1)——debugfs: http://www.cnblogs.com/hoys/archive/2011/04/10/2011124.html
DebugFS in the Linux kernel: http://www.cnblogs.com/wwang/archive/2011/01/17/1937609.html
Introduction to using Debugfs for Linux driver debugging: http://soft.chinabyte.com/os/110/12377610.shtml
Introduction and use of Linux Debugfs file system: http://blog.sina.com.cn/s/blog_40d2f1c80100p7u2.html
DebugFS in the Linux kernel: http://www.cnblogs.com/wwang/archive/2011/01/17/1937609.html
Debugging the Linux Kernel with debugfs: http://opensourceforu.com/2010/10/debugging-linux-kernel-with-debugfs/
debugfs-seq_file: http://lxr.free-electrons.com/source/drivers/base/power/wakeup.c
Introduction and use of Linux Debugfs file system: http://blog.sina.com.cn/s/blog_40d2f1c80100p7u2.html
Linux file systems: procfs, sysfs, debugfs Usage: http://www.tinylab.org/show-the-usage-of-procfs-sysfs-debugfs/
The way of exchanging data between user space and kernel space (1)——debugfs: http://www.cnblogs.com/hoys/archive/2011/04/10/2011124.html
Linux debugging method using debugfs: http://www.xuebuyuan.com/1023006.html
2.4 relayfs file system
relayfs
It is a fast
relay
data forwarding ( ) file system, which is named after its function. It provides a fast and efficient forwarding mechanism for tools and applications that need to forward large amounts of data from kernel space to user space.
Channel
It is
relayfs
a main concept defined by the file system. Each
channel
file consists of a set of kernel caches. Each file
CPU
has a kernel cache corresponding to it
channel
. Each kernel cache
is represented by a file
relayfs
in the file system
. The kernel uses
the write function provided by the kernel to quickly write the data that needs to be forwarded to the user space into
the kernel cache
on
the current file. The user space application
can quickly obtain
the forwarded data
in the
corresponding
file
through the standard file
O function
. The format of the data written to
the kernel depends entirely on
the module or subsystem created in the kernel.
relayfs
CPU
channel
I/
channel
mmap
channel
channel
relayfs
User space
API
:
relayfs
Implements four
standard file
I/O
functions,
open、mmap、poll和close
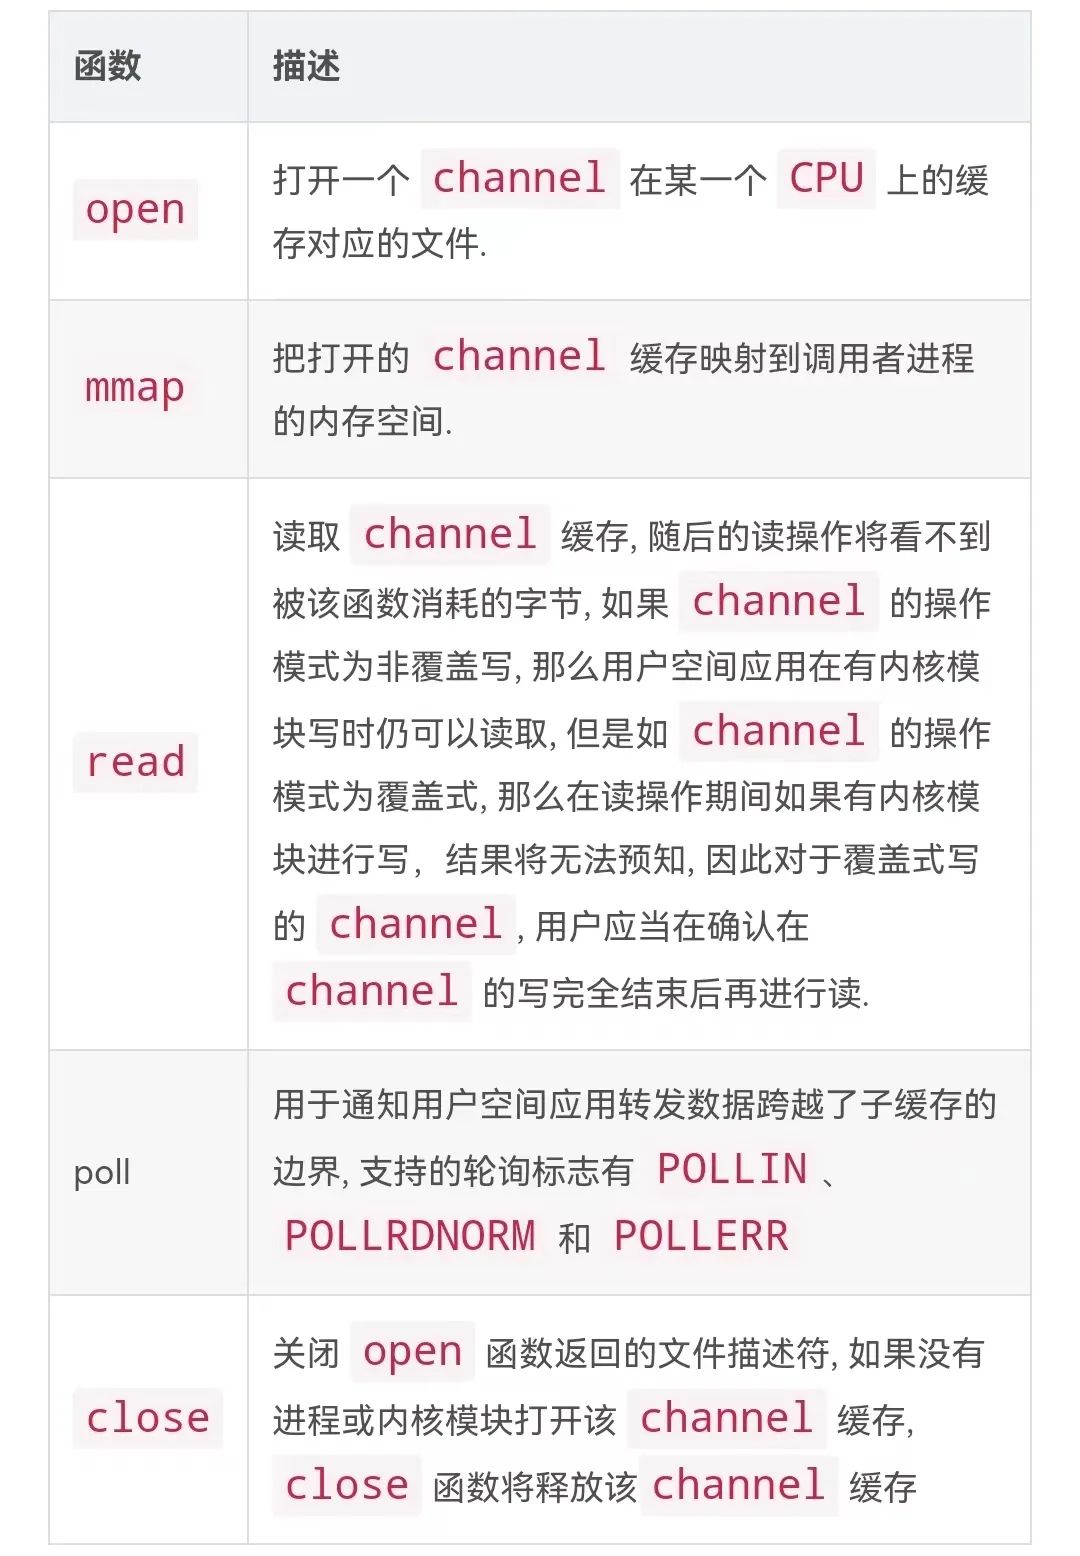
Note: User-mode applications must ensure that the relayfs file system has been mounted when using the above API, but the kernel does not require relayfs to be mounted when creating and using channels. The following command will mount the relayfs file system to /mnt/relay.
Related links:
Methods of exchanging data between user space and kernel space (4)——relayfs: http://www.cnblogs.com/hoys/archive/2011/04/10/2011270.html
Relay: An efficient data transmission technology from kernel to user space: https://www.ibm.com/developerworks/cn/linux/l-cn-relay/
2.5 seq_file
Generally, the kernel
procfs
provides output information to the user space by creating a file under the file system. The user space can view the file information through any text reading application. However,
procfs
there is a flaw. If the output content is larger than one memory page, it needs to be read multiple times,
so it is difficult to process. In addition, if the output is too large, the speed is slow, and sometimes some unexpected situations may occur.
Alexander Viro
A new set of functions is implemented to make it easier for the kernel to output large file information. This function appears in
all kernels after
2.4.15
(including
2.4.15
)
2.4
and
2.6
kernels. In particular
2.6
, this function has been widely used in the kernel.
Related links:
The way of exchanging data between user space and kernel space (3)——seq_file: http://www.cnblogs.com/hoys/archive/2011/04/10/2011261.html
Kernel proc file system and seq interface (4) - A brief analysis of seq_file interface programming: http://blog.chinaunix.net/uid-20543672-id-3235254.html
Seq operation in Linux kernel: http://www.cnblogs.com/qq78292959/archive/2012/06/13/2547335.html
seq_file source code analysis: http://www.cppblog.com/csjiaxin/articles/136681.html
Use the sequence file (seq_file) interface to export common data structures: http://blog.chinaunix.net/uid-317451-id-92670.html
seq_file mechanism: http://blog.csdn.net/a8039974/article/details/24052619
3 printk
Among kernel debugging techniques, the simplest one is
printk
the use of , which
printf
is similar to the use of in C language applications. In applications,
stdio.h
the library in is relied on, but
linux
there is no such library in the kernel, so in
linux
the kernel, a set of library functions is implemented,
printk
which is the standard output function
Related links:
Linux kernel debugging technology printk: http://www.cnblogs.com/veryStrong/p/6218383.html
Adjust the print level of kernel printk: http://blog.csdn.net/tonywgx/article/details/17504001
Linux device driver study notes – kernel debugging method printk: http://blog.csdn.net/itsenlin/article/details/43205983
4 ftrace && trace-cmd
4.1 trace && ftrace
Linux
The most powerful debugging and tracing tool in the current version. Its most basic function is to provide dynamic and static detection points for detecting relevant information at specified locations in the kernel.
Static detection points are implemented by calling the corresponding interface provided in the kernel code
ftrace
. They are called static because they are hard-coded in the kernel code and statically compiled into the kernel code. After the kernel is compiled, they cannot be dynamically modified. After turning on
the
ftrace
relevant kernel configuration
options, static detection points have been set in some key places in the kernel. When you need to use them, you can view the corresponding information.
Dynamic detection points, the basic principle is: using
mcount
the mechanism, when the kernel is compiled, several bytes are reserved at the entrance of each function, and then when is used
ftrace
, the reserved bytes are replaced with the required instructions, such as jumping to the code required to perform the detection operation.
ftrace
Its role is to help developers understand
Linux
the runtime behavior of the kernel for troubleshooting or performance analysis.
At first
,
ftrace
it was a tool
function tracer
that could only record the kernel's function call process. Now,
ftrace
it has become a
framework
, using
plugin
the approach to support developers to add more types of
trace
features.
Ftrace
Maintained by
RedHat
of
Steve Rostedt
. So
2.6.30
far, supported
tracer
include:

This is not an exhaustive list
tracer
,
ftrace
and is currently a very active area of development, with new features
tracer
being added to the kernel on a continuous basis.
Related links:
ftrace and its front-end tool trace-cmd (a powerful tool for in-depth understanding of Linux systems): http://blog.yufeng.info/archives/1012
Introduction to ftrace: https://www.ibm.com/developerworks/cn/linux/l-cn-ftrace/
Kernel performance debugging – ftrace: http://blog.chinaunix.net/uid-20589411-id-3501525.html
Debugging the Linux kernel with ftrace, Part 1: https://www.ibm.com/developerworks/cn/linux/l-cn-ftrace1
Use of ftrace: http://blog.csdn.net/cybertan/article/details/8258394
[Transfer] Linux kernel trace framework analysis: http://blog.chinaunix.net/uid-24063584-id-2642103.html
Getting started with Linux trace: http://blog.csdn.net/jscese/article/details/46415531
4.2 ftrace front-end tool trace-cmd
trace-cmd
and open source
kernelshark
are both kernel
Ftrace
front-end tools, used to analyze kernel performance.
They are equivalent to a
/sys/kernel/debug/tracing
wrapper of the file system interface in , providing users with more direct and convenient operations.
sudo trace-cmd reord subsystem:tracing
trace-cmd: A front-end for Ftrace: https://lwn.net/Articles/410200/
Its essence is to
/sys/kernel/debug/tracing/events
operate each module, collect data and analyze
5 Kprobe && systemtap
5.1 Kernel kprobe mechanism
kprobe
It is
linux
an important feature of the kernel, a lightweight kernel debugging tool, and it is also
the "infrastructure" of
some other more advanced
kernel debugging tools (such as
perf
and
). In the 4.0 version of the kernel, the powerful
feature is also parasitic
on , so
the status of in the kernel can be seen.
systemtap
eBPF
kprobe
kprobe
Kprobes
Provides an interface to break into any kernel routine and collect information from interrupt handlers non-intrusively. Using ,
Kprobes
debug information such as processor registers and global data structures can be collected. Developers can even use
Kprobes
to modify register values and global data structures.
How to debug the kernel efficiently?
printk
is a method, but
printk
is ultimately a full output without any choice, which is not practical in some scenarios, so you can try it
tracepoint
, I will
tracepoint
only output when I enable the mechanism. Compared with the way of stupidly placing
printk
to output information,
tracepoint
it is an improvement, but
tracepoint
is just some static anchor points deployed by the kernel on certain specific behaviors (such as process switching). These anchor points are not necessarily what you need, so you still need to deploy them yourself
tracepoint
and recompile the kernel. Then
kprobe
the emergence of is very necessary, it can dynamically insert detection points in the running kernel and perform your predefined operations.
Its basic working mechanism is: the user specifies a detection point and associates a user-defined processing function with the detection point. When the kernel executes to the detection point, the corresponding associated function is executed, and then the normal code path continues to be executed.
kprobe
Three types of probe points are implemented:
kprobes
,
jprobes
and
kretprobes
(also called return probe points).
kprobes
is
a probe point that can be inserted into any instruction position of the kernel,
jprobes
, can only be inserted into the entry of a kernel function, and
kretprobes
is executed when the specified kernel function returns.
Related links:
Working principle of kprobe: http://blog.itpub.net/15480802/viewspace-1162094/
Random Thoughts (Powerful kprobe): http://blog.csdn.net/feixiaoxing/article/details/40351811
Kprobe principle analysis (I): http://www.cnblogs.com/honpey/p/4575928.html
5.2 Front-end tool systemtap
SystemTap
is a dynamic method for monitoring and tracking the operation of a running
Linux
kernel. The key word here is dynamic, because
SystemTap
does not build a special kernel with a tool, but allows you to install the tool dynamically at runtime. It does this through an
Kprobes
application programming interface (
API
).
SystemTap
Similar to an
DTrace
older technology called , which originated in
Sun Solaris
the operating system. In
DTrace
, developers can write scripts in
D
the programming language (
C
a subset of the language, but modified to support tracing behavior).
DTrace
The script contains a number of probes
and associated actions that occur when the probes are "triggered". For example, a probe can represent a simple system call or a more complex interaction, such as executing a specific line of code
DTrace
is
Solaris
the most notable part of , so it is not surprising that it is developed in other operating systems.
DTrace
It was
Common Development and Distribution License (CDDL)
released under , and was ported to
FreeBSD
the operating system.
Another very useful kernel tracing tool is
ProbeVue
, which is
developed
IBM
for
IBM® AIX®
operating systems
. You can use to
profile the behavior and performance of the system, as well as provide detailed information about a particular process. This tool uses a standard kernel to perform tracing in a dynamic manner.
6.1
ProbeVue
Considering
the huge role of
DTrace
and
ProbeVue
in their respective operating systems,
Linux
it was inevitable to plan an open source project to implement this feature for the operating system.
SystemTap
Since
2005
began development, it provides
similar
features to
DTrace
and
ProbeVue
. Many communities have also further improved it, including
Red Hat
,
Intel
,
Hitachi
and
IBM
.
These solutions are similar in functionality, using probes and associated action scripts when the probes are triggered.
Related links:
SystemTap Learning Notes - Installation: https://segmentfault.com/a/1190000000671438
Linux Introspection and SystemTap Interface and language for dynamic kernel analysis: https://www.ibm.com/developerworks/cn/linux/l-systemtap/
Brendan's blog Using SystemTap: http://dtrace.org/blogs/brendan/2011/10/15/using-systemtap/
Kernel debugging tool SystemTap - Introduction and use (I): http://blog.csdn.net/zhangskd/article/details/25708441
Introduction to kernel detection tool systemtap: http://www.cnblogs.com/hazir/p/systemtap_introduction.html
SystemTap Beginner: http://blog.csdn.net/kafeiflynn/article/details/6429976
Using systemtap to debug the Linux kernel: http://blog.csdn.net/heli007/article/details/7187748
Ubuntu Kernel Debuginfo: http://ddebs.ubuntu.com/pool/main/l/linux
A new performance measurement and debugging diagnostic tool Systemtap under Linux, Part 3: Systemtap: https://www.ibm.com/developerworks/cn/linux/l-cn-systemtap3/
6 kgdb && kgtp
6.1 kgdb
KGDB
It is a well-known kernel debugging tool, which is
a merger
of the
KDB
and
projects.
KGDB
kdb
It is a kernel debugger for Linux system. It is an open source debugging tool developed by SGI and follows the GPL license. It
kdb
is embedded
Linux
in the kernel. It provides debugging tools for kernel and driver programmers. It is suitable for debugging program code in kernel space. For example, debugging device drivers and kernel modules.
kgdb
and
kdb
have now been merged. For a running
kgdb
, you can use
gdbmonitor
the command to use
kdb
the command. For example
You can run
kdb
the
ps
command.
Analyze
the differences
kdb
between patches and merging into the mainline
kdb
kdb
After merging with
kgdb
, you can also use
kgdb
's
IO
drivers (such as keyboards), but at the same time also
kdb
loses some functions.
After the merger,
kdb
no longer supports assembly-level source code debugging. So it is now also platform-independent.
-
kdump and kexec have been removed.
-
Less information is obtained from /proc/meninfo than before.
-
The bt command now uses the kernel's backtracer instead of the disassembler that kdb originally used.
-
The merged kdb no longer has the original disassembly (id command)
To sum up:
after merging
kdb
with
kgdb
, there is almost no clear boundary between these two debugging methods in the system. For example, when accessing remotely through the serial port, you can use
kgdb
the command, or you can use
kdb
the command (implemented using gdb monitor)
6.2 KGTP
KGTP
is a real-time lightweight
Linux
debugger and tracer.
KGTP
To use it
,
KGTP
you don't need
Linux
to install it on the kernel
PATCH
or recompile it. Just compile the KGTP module and
insmod
install it.
It allows
Linux
the kernel to provide a remote
GDB
debugging interface, so that GDB on a local or remote host can
GDB tracepoint
debug and trace without stopping the kernel using and other features
Linux
.
Even if there is no on the board
GDB
and no remote interface is available,
KGTP
you can debug the kernel using the offline debugging feature (see
http://code.google.com/p/kgtp/wiki/HOWTOCN#/sys/kernel/debug/gtpframe
and offline debugging).
KGTP supports X86-32, X86-64, MIPS and ARM.
KGTP has been tested on Linux kernel 2.6.18 to upstream.
And it can also be used on Android (see
http://code.google.com/p/kgtp/wiki/HowToUseKGTPinAndroid
)
Related links:
github-KGTP: https://github.com/teawater/kgtp
KGTP kernel debugging usage: http://blog.csdn.net/djinglan/article/details/15335653
Add support for GDB command "set trace-buffer-size" in KGTP - Week 5: http://blog.csdn.net/calmdownba/article/details/38659317
7 perf
Perf
It is a tool for software performance analysis.
Through it, applications can use
PMU
special
tracepoint
counters in the kernel to perform performance statistics. It can not only analyze
the performance problems of specified applications (
per thread
). It can also be used to analyze kernel performance problems. Of course, it can also analyze application code and kernel at the same time to fully understand the performance bottlenecks in the application.
Initially, it was called
Performance counter
, and
2.6.31
made its debut in . Since then, it has become one of the most active areas of kernel development. In ,
2.6.32
it was officially renamed
Performance Event
, because
perf
is no longer just an
PMU
abstraction of
, but can handle all performance-related events.
Using
perf
, you can analyze hardware events that occur during program execution, such as
instructions retired
,
processor clock cycles
etc.; you can also analyze software events, such as
Page Fault
and process switching.
This allows
Perf
to have a lot of performance analysis capabilities, for example, using
Perf
can count the number of instructions per clock cycle, called
IPC
,
IPC
a low number indicates that the code is not well utilized
CPU
.
Perf
You can also perform function-level sampling on the program to understand where the program's performance bottleneck is, etc.
Perf
You can also replace
strace
and add dynamic kernel
probe
points. You can also
benchmark
measure the quality of the scheduler.
People may call it the "Swiss Army Knife" for performance analysis, but I don't like this metaphor. I think
perf
it should be a rare sword in the world.
Many people in Jin Yong's novels have a fetish for precious swords. Even if they are too weak to own one, they just like it and can't help it. I'm afraid I'm just like these people. So when I go to a pub or inn, I'll be eager to tell the story of the Heavenly Sword to people I know or don't know.
Related links:
Perf - System Performance Tuning Tools under Linux, Part 1: https://www.ibm.com/developerworks/cn/linux/l-cn-perf1/index.html
perf Examples: http://www.brendangregg.com/perf.html
Improved version of perf, Performance analysis tools based on Linux perf_events (aka perf) and ftrace: https://github.com/brendangregg/perf-tools
Perf usage tutorial: http://blog.chinaunix.net/uid-10540984-id-3854969.html
Introduction to the use of perf, a kernel testing tool under Linux: http://blog.csdn.net/trochiluses/article/details/10261339
perf transplant: http://www.cnblogs.com/helloworldtoyou/p/5585152.html
8 Other Tracer Tools
8.1 LTTng
LTTng
It is an
Linux
open source tracing tool for the platform, a set of software components that allow tracing of
Linux
kernel and user programs, and
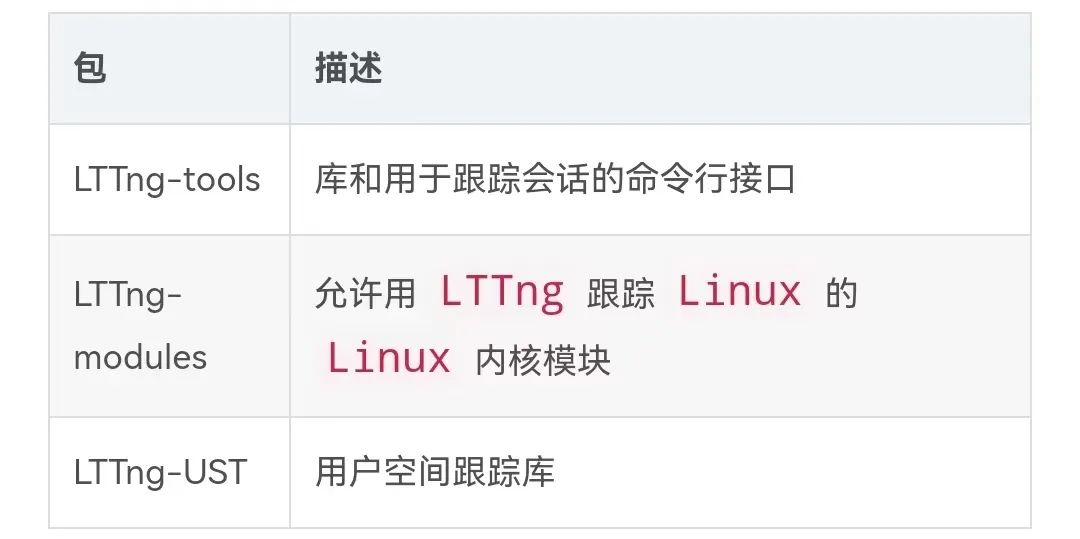
control of tracing sessions (start/stop tracing, start/stop events, etc.). These components are bundled into three packages:
Related links:
Open source tracking tool for Linux platform: LTTng: http://www.open-open.com/lib/view/open1413946397247.html
Use lttng to trace the kernel: http://blog.csdn.net/xsckernel/article/details/17794551
LTTng and LTTng project: http://blog.csdn.net/ganggexiongqi/article/details/6664331
8.2 eBPF
The extended Berkeley Packet Filter (eBPF) is an efficient kernel virtual machine (JIT) that can run programs on events.
It may eventually provide kernel programming of ftrace and perf_events, and enhance other tracers. It is currently being developed by Alexei Starovoitov. It is not fully integrated yet, but since 4.1 there is enough kernel support for some excellent tools, such as
latency heatmaps for block device I/O. See the BPF slides and eBPF samples of its main author Alexei Starovoitov.
8.3 Ktap
ktap used to be a promising tracer that used the in-kernel lua VM to
run well on embedded devices without debug information. It was developed in several steps and for a while seemed to be ahead of all tracers on Linux. Then eBPF started kernel integration and ktap integration started after it could replace its own VM with eBPF. Since
eBPF integration will still take several months, ktap developers will have to wait for a while. I hope it will be re-developed later this year.
8.4 dtrace4linux
dtrace4linux is a Linux port of Sun DTrace, written mostly by Paul Fox in his spare time. It has a lot of traction
and some providers are working, but it is somewhat incomplete and more of an experimental tool (not safe). I think people will be wary of contributing to dtrace4linux due to licensing issues: Sun open sourced
DTrace under the CDDL, and dtrace4linux is unlikely to end up in the Linux kernel. Paul's approach will probably make it an add-on. I'd love to see DTrace on Linux and the project complete, and I think
I'll spend some time helping with it once I join Netflix. However, I'm going to continue to use the built-in tracers, such as ftrace and perf_events.
8.5 OL DTrace
Oracle Linux DTrace has made a great effort to bring DTrace to Linux, and Oracle Linux in particular.
The multiple releases over the years show steady progress. The developers talk about improving the DTrace test suite in a positive way about the future of the project. Many useful providers have been completed, such as syscall, profile, sdt, proc, sched, and
USDT. I am looking forward to the completion of fbt (function boundary tracing, for kernel dynamic tracing), which is a great provider for the Linux kernel. The ultimate success of OL DTrace will depend on how much
interest people have in running Oracle Linux (paying for support), and on whether it is fully open source: its kernel components are open source, but I have not seen its user-level code.
8.6 sysdig
Sysdig is a new tracer that uses a tcpdump-like syntax to manipulate system events, and it uses lua to submit processes. It's great, and it's seen
a revolution in the field of system tracing. It's limited in that it only does the current system call, and dumps all events to user level when the submission is made. You can do a lot with system calls, but I would like to see support for tracepoints, kprobes, and
uprobes. I'm also looking forward to it supporting eBPF for kernel summaries. Currently, the sysdig developers are adding container support. Keep an eye out for those.
Autumn
The recruitment has already begun. If you are not well prepared,
Autumn
It is difficult to find a good job.
Here is a big employment gift package for everyone. You can prepare for the spring recruitment and find a good job!


 京公网安备 11010802033920号