Theoretical Motor Model

Key Parameters Explanation

Using Simulink to build a motor model

Key Components
Rotary electromechanical converter (electrical signal to mechanical signal)

Function: Provides an interface between the electrical and mechanical rotational domains. If the current and voltage through the electrical port are I and V, and the torque and angular velocity through the mechanical port are T and w, then
T = K * I
V = K * w
Use this module as a torque/back EMF
Parameter: Proportional coefficient K
Ideal mechanical moment of inertia

**Function:** represents the motor's moment of inertia
**Parameters:** Moment of inertia I
Key parameters affecting the motor model


Target
We assume that the parameters that affect motor performance: IRLK are all 1, but we have an actual motor. Obviously, the actual motor parameters cannot all be 1. We use the Simulink Design Optimization toolbox to adjust four parameters to make the simulation model and the actual motor highly matched.
Measurement data preparation
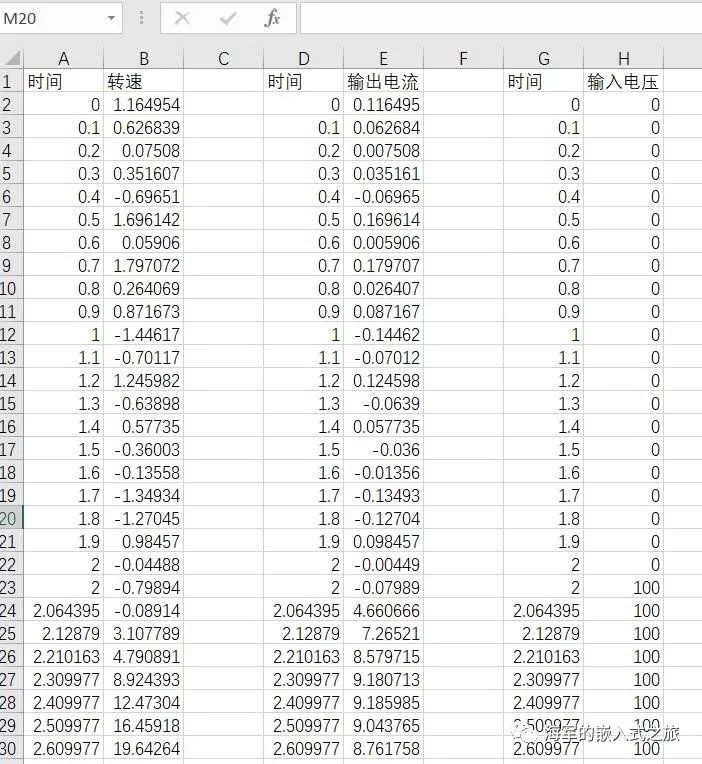
The data that needs to be measured are:

Data information is saved using Excel documents

Measurement data visualization
%Read data time=xlsread('data file','A2:A107');
speed=xlsread('data file','b2:b107');current=xlsread('data file','e2:e107');
input_v=xlsread('data file','h2:h107');

% Speed--time image subplot(2,2,1)
plot(time,speed,'r');
xlabel('Time (seconds)');
ylabel('speed');

% Current-time image subplot(2,2,2)
plot(time,current,'r');
xlabel('Time (seconds)');
ylabel('Current');

% Given value -- time image subplot (2,2,3)
plot(time,input_v,'r');
xlabel('Time (seconds)');
ylabel('given value');

Parameter estimation steps
-
Open "parameter analyzer"

-
Load estimation data, test data

Add estimation parameter IKLR

Add test parameters

-
Add visualization images: four parameter change images, speed-time, current-time, given value-time images

-
run
Picture of the simulation in progress:

result
Four parameter change diagrams

Comparison chart of measured and simulated values


After simulink simulation, the four parameters changed significantly, and the measured data and simulation data were highly consistent.
Previous article:Introduction to H-bridge drive for DC motor speed regulation
Next article:The difference between undervoltage protection and loss of voltage protection. The design and function of undervoltage protection circuit.
- Popular Resources
- Popular amplifiers
- Huawei's Strategic Department Director Gai Gang: The cumulative installed base of open source Euler operating system exceeds 10 million sets
- Analysis of the application of several common contact parts in high-voltage connectors of new energy vehicles
- Wiring harness durability test and contact voltage drop test method
- Sn-doped CuO nanostructure-based ethanol gas sensor for real-time drunk driving detection in vehicles
- Design considerations for automotive battery wiring harness
- Do you know all the various motors commonly used in automotive electronics?
- What are the functions of the Internet of Vehicles? What are the uses and benefits of the Internet of Vehicles?
- Power Inverter - A critical safety system for electric vehicles
- Analysis of the information security mechanism of AUTOSAR, the automotive embedded software framework
 Professor at Beihang University, dedicated to promoting microcontrollers and embedded systems for over 20 years.
- LED chemical incompatibility test to see which chemicals LEDs can be used with
- Application of ARM9 hardware coprocessor on WinCE embedded motherboard
- What are the key points for selecting rotor flowmeter?
- LM317 high power charger circuit
- A brief analysis of Embest's application and development of embedded medical devices
- Single-phase RC protection circuit
- stm32 PVD programmable voltage monitor
- Introduction and measurement of edge trigger and level trigger of 51 single chip microcomputer
- Improved design of Linux system software shell protection technology
- What to do if the ABB robot protection device stops
- Car key in the left hand, liveness detection radar in the right hand, UWB is imperative for cars!
- After a decade of rapid development, domestic CIS has entered the market
- Aegis Dagger Battery + Thor EM-i Super Hybrid, Geely New Energy has thrown out two "king bombs"
- A brief discussion on functional safety - fault, error, and failure
- In the smart car 2.0 cycle, these core industry chains are facing major opportunities!
- The United States and Japan are developing new batteries. CATL faces challenges? How should China's new energy battery industry respond?
- Murata launches high-precision 6-axis inertial sensor for automobiles
- Ford patents pre-charge alarm to help save costs and respond to emergencies
- New real-time microcontroller system from Texas Instruments enables smarter processing in automotive and industrial applications
- Sandia Labs develops battery failure early warning technology to detect battery failures faster
- EEWorld will meet you offline and give you a 2,000 yuan ticket. Please come to the lucky draw.
- What you should know about electronic circuit maintenance: resistors
- ESP-EYE cannot make defconfig
- A magical BUG occurred when Linux used ITIMER_REAL and ITIMER_VIRTUAL timers at the same time
- Li-Fi: A wireless connection technology that doesn't require radio
- After the live broadcast: Can we work on a speech recognition project together? Can we?
- Weekly review information is here~ Multiple development boards are online, waiting for you to apply
- EEWORLD University Hall----Intel Packaging Co-EMIB
- How to use bidirectional DC/DC converters in elevator emergency rescue devices to improve efficiency and reduce costs
- Determination of Current Limiting Resistance of Zener Diode

 SHC298JU


 京公网安备 11010802033920号