1 System Hardware Structure Overview
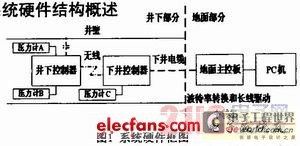
The hardware part is shown in Figure 1, which mainly includes three parts: ground control system, downhole controller and downhole controller. The ground control system has three working modes: ground mode, transfer mode and direct mode. The main function of the ground mode is to configure and test the pressure gauge on the ground. In the transfer mode, the ground control system is the connection unit between the PC and the downhole controller. It does not actively send instructions, but can display real-time data. In the direct mode, the ground controller can independently control the downhole system without the participation of the PC, which greatly improves the portability of the oil well field operation. The main functions include downhole real-time data calculation and display, downhole command sending, downhole command reception and corresponding downhole data return storage. The downhole controller is designed for the downhole pressure gauge, mainly to realize the real-time pressure tracking during the downhole process, complete the connection and maintenance of the pressure gauge and the return of pressure data. The downhole controller is designed for the downhole pressure gauge, and its main function is to receive and execute the operation instructions issued by the ground control system, and complete a series of functions such as power management, mode switching, and data reading of the pressure gauge.
2 Principles of long-distance data transmission
The method described in this paper has many technical difficulties, one of which is long-distance data transmission. Downhole and downhole pressure gauges and circuit boards work in oil wells 4000 to 6000 meters above the ground. The pressure, temperature, humidity, and noise downhole are very different from those on the ground. In addition, due to the long transmission distance, the distributed resistance and distributed capacitance of the transmission line are large, which greatly attenuates the signal carried. In addition, there are unfavorable factors such as impedance modulation, pulse noise, and equal-amplitude oscillation wave interference, making it difficult to achieve high-speed transmission. For this purpose, a large number of experiments were conducted to simulate long-line transmission, and experiments were conducted on site with actual cables. Finally, the more reliable spread spectrum communication (Spread Spectrum Conummicadon) was adopted as the way to transmit commands and data.
Spread spectrum communication refers to a communication method in which the signal bandwidth used to transmit information in the transmission system is much larger than the bandwidth of the information itself. That is, the baseband signal to be transmitted is spread spectrum modulated using the pseudo-random code generated by the spread spectrum sequence generator to expand the spectrum and form a low-power spectrum density signal with an extended bandwidth for transmission. The receiving end uses the same pseudo-random code to restore it to a narrowband signal through correlation processing, and then demodulates the data to restore the original signal data.
From Shannon's formula we can understand the theoretical origin of spread spectrum communication. In a channel subjected to additive white Gaussian noise, the channel capacity is described by the following formula:
Under a given channel capacity, different combinations of bandwidth and signal-to-noise ratio can be used for transmission. If one of them is reduced, the other must be increased to balance the inherent capacity of the channel. Therefore, when the signal-to-noise ratio is too small to guarantee the communication quality, a broadband system is often used, that is, increasing the bandwidth (broadening the spectrum) to increase the channel capacity, expanding the signal spectrum to reduce the power spectrum density, thereby reducing the signal amplitude and improving the concealment to improve the communication quality. This is the so-called communication method of exchanging bandwidth for power.
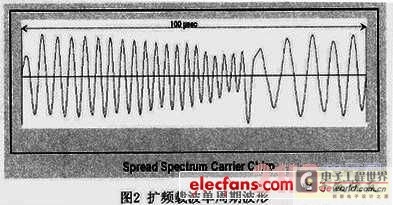
The spread spectrum signal of the system described in this article uses a series of short, self-synchronized scanning frequency chirps as the carrier. Each chirps generally lasts 100 μs, representing the most basic communication symbol time. Since the linear scanning bandwidth of the chirps signal is much larger than the signal bandwidth, its linear acceleration is higher, and the frequency acceleration of the equal-amplitude oscillation interference is generally stable, so the filter designed for a specific angular acceleration signal can eliminate the interference. In addition, the chirps waveform also has a strong autocorrelation characteristic. This fuzzy logic correlation determines that all devices in the communication system can simultaneously identify this unique waveform emitted by any device in the communication system, and there is no need for synchronization between the sending and receiving devices. Figure 2 shows the waveform of a spread spectrum carrier chirps cycle.
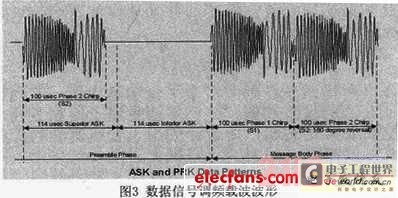
The communication interface controller selected by the system is a highly integrated transceiver and channel access interface, which adopts the Spread Spectrum Carrier technology, is applicable to the CEBus interface standard, and has strong anti-interference ability. The communication physical layer adopts two carrier modulation methods: Amplitude Shift Keying (ASK) and Phase Reversal Keying (PRK), as shown in Figure 3. ASK modulation is used for the preamble of the information packet, and the presence or absence of chirps is represented by high level and low level respectively. The encoded data segment adopts PRK modulation, and the transmitted digital signal is encoded and represented by two phases S1 and S2 with a difference of 180°. In the data frame, "0" and "1" are modulated and transmitted with signals in phase and inverse phase with the carrier respectively. PRK modulation can maintain good correlation with the signal flag and can track well. In this environment, the long-distance transmission performance is significantly better than ASK, and the actual transmission rate of 9.6kbps can be achieved, which well meets the needs of actual real-time operation.
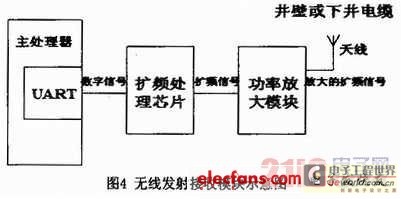
The actual communication module implementation principle and process description: The analog communication signal first enters the spread spectrum processing module, and then is amplified by the cache and converted into a digital signal by ADC. The digital processing of the input signal includes the use of matched filtering to detect the spread spectrum carrier chirps and track the received signal. The received signal information is transmitted to the logic interface for decoding via a specific digital signal processing circuit, and is allocated and finally transmitted to the main processing module for processing according to the established communication protocol. The analog signal after spread spectrum processing is amplified and output by the power amplifier module and finally coupled to the wireless transmitting antenna to complete the transmission and reception functions of the wireless signal. Figure 4 shows a schematic diagram of the wireless transmission and reception module.
3 Data collection and processing
3.1 Pressure gauge theoretical model
As the main unit for collecting downhole oil and gas parameter data, the characteristics of the pressure gauge will have a direct impact on the well test analysis. In order to determine and evaluate the extent of this impact, the commonly used method is to use computer simulation analysis (also known as the transfer function method). In the method introduced in this article, a theoretical model of the pressure gauge is established. The model is based on the existing pressure gauge performance specifications, test quality control and the basic physical principles of general pressure sensors. It is mainly used to evaluate the impact of temperature response, noise and non-ideal electronic pressure equipment on data processing.
3.1.1 Pressure gauge transfer function
The pressure gauge transfer function mathematically describes the entire process of the pressure gauge test and establishes the relationship between the pressure temperature output response and the input pressure temperature. If the pressure gauge sensor and data processing are ideal, an output r(t) that accurately represents the measured pressure P(t) at each moment will be generated; if the pressure gauge is not ideal, then the measured value will contain errors such as short-term drift, long-term drift and noise.
For a manometer, the relationship between its output r(t) and the known pressure and temperature can be expressed as:
r(t)=g[P(t), T(t), pressure gauge parameters]
Here g[] is the pressure gauge transfer function, which provides a mathematical description of the static and dynamic relationships, that is, it gives the rules for calculating the pressure gauge output given the known inputs and pressure gauge parameters. In addition, it can also define the pressure gauge specifications and quality control parameters in a consistent and reasonable way.
3.1.2 Pressure gauge data processing model
The pressure transfer function can be determined based on the pressure gauge specifications, calibration data and quality control test results. The general pressure gauge model includes the following characteristic parameters: r1 = short-term drift (less than 24hr), MPa; r2 = long-term drift (greater than 24hr), MPa; r3 = pressure error caused by temperature gradient, MPa; r4 = pressure test noise error, MPa.
The following equation can be used to model the response of a manometer for a given pressure and temperature step:

rr is the total response pressure value of the pressure gauge, MPa; t0 is the initial response time, hr; △t is the time increment of pressure change, hr.
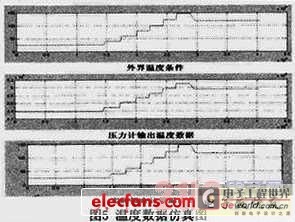
The actual pressure gauge calculation model designs different specific segmented fitting methods according to the different change trends of actual temperature and pressure, and achieves good results through Matlab simulation tools. The specific simulation results are as follows:
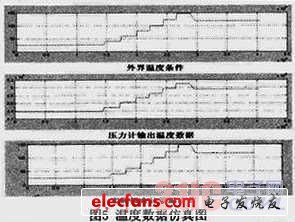
As shown in Figure 5, it can be seen that the temperature data output by the pressure gauge accurately reflects the actual situation, and the temperature value obtained by the temperature calculation model method adopted has a high accuracy.
Figure 6 Pressure data simulation diagram
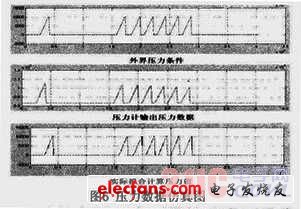
From the data comparison shown in Figure 6, it can be seen that the pressure error caused by the temperature drift of the pressure gauge has been compensated, and the value obtained by the pressure calculation model is basically consistent with the actual external condition value.
3.2 Practical design of pressure gauge
Electronic pressure gauge is a kind of measurement system with some characteristics. In fact, it belongs to signal acquisition system. Its input is pressure and temperature analog signal, and its output is quantized digital quantity. The actual module can be roughly divided into three parts: analog part, digital part and power management part. The general block diagram is as follows:
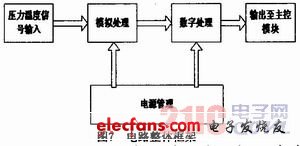
The main function of the analog circuit part is to filter out the high-frequency components in the pressure gauge signal after cable transmission through low-pass filtering, and to digitize the analog signal.
The digital circuit part takes into account the system frequency band limitation of long-distance transmission and the partial response baseband transmission method adopted for the pressure gauge signal output, so the original signal needs to be processed by the hardware circuit to restore the data signal for the main processor to process.
The digital signal is first deburred and then divided into two paths. One path is not processed, and the other path passes through a shift circuit consisting of two FIFO registers and a shift register. The precisely shifted signal is XORed with the original signal to restore the data signal. After filtering, it is directly sent to the main processor for related processing and sent out at the designated port. The circuit is equipped with an oscillator of a certain frequency, which is used as the driving clock signal of the queue register and shift register after frequency division.
The power management module provides the operating voltage required by each module of the system and has a high-temperature protection function. When the temperature is too high, the power supply is automatically cut off, and the feedback loop of the filter circuit is cut off when the power is off. When the temperature drops, it can automatically resume work to achieve temperature control of the filter circuit.
The pressure gauge control system adopts a complete set of pressure gauge management communication protocols, which specifies the specific format of data, including frame classification method, frame length determination format, frame data meaning positioning, etc. This set of communication protocols supports the stable and reliable operation of the entire system, fully meeting the needs of on-site and underground interactive communication and actual oil well testing.
4 Application Test
The remote control well test system described in this paper has been put into practical use many times on the Bohai drilling platform. The latest test was conducted in July 2010. The test well depth was 2253.79m, the test well section was 2104.0~2109.0m, the production was: oil 114.3m3/d, gas 11104m3/d, flow pressure 16.02Mpa, production pressure difference 1.90Mpa, maximum formation pressure 17.92Mpa, and the measured temperature at the measuring point was 82.7℃. The downhole detection system is located at a depth of 2045.42m. The measured data is transmitted to the downhole controller through the wireless transmitting and receiving module, and analyzed by the ground computer. At the same time, the downhole detector is controlled in real time with the help of the downhole controller. The pressure and temperature change process curve recorded during the entire well test operation is shown in Figure 8.
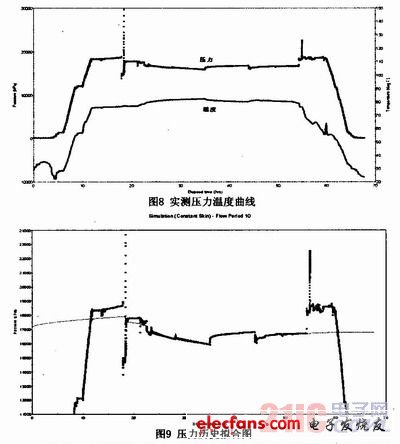
The actual measurement curve of the system accurately reflects the changing trend corresponding to the entire operation process of the well, and the theoretical value fitting of the pressure curve from the initial well closing to the second well opening in the process is performed through special analysis software, as shown in Figure 9.
As can be seen from the figure, the fitting results faithfully reflect the changing trend of the actual measured pressure, which is basically consistent with the actual oil well related operations. Including the initial shut-in pressure value, which jumps and drops rapidly, and then quickly recovers to near static pressure. A series of subsequent oil well operations are all faithfully reflected in the pressure change diagram, until the second well opening pressure value rises rapidly and immediately returns to the initial pressure value. As the oil well production operation ends, the pressure value gradually returns to zero.
5 Conclusion
The system described in this paper has been applied in multiple platforms in Bohai Sea, accurately extracting parameter data of underground oil, and has been applied for a national patent. Field tests and applications show that the spread spectrum communication method designed for long-line drive can successfully transmit underground data to the wellbore without error, and at the same time transmit the wellbore control command to the wellbore, completing the two-way remote control operation between the wellbore and the wellbore. The longest transmission distance achieved by the system introduced in this paper basically meets all existing well depths in China, and the transmission method is reliable and stable. In addition, the actual model of the pressure gauge and the calculation methods such as segmented fitting used have been shown through actual measurement data to be able to accurately reflect the actual situation underground, and the measurement range and accuracy meet the actual needs well.
Due to the large differences in the environment of different oil wells, the communication of the system will be unpredictable, so its anti-interference performance needs to be further improved through multiple experimental studies. In addition, due to the actual logging cycle, the power supply requirements of the system are relatively stringent, so the power consumption and energy saving of the entire system are also the main aspects that need to be improved in the future.
Previous article:Common connection methods between LCD and IC
Next article:Design of EPA field controller
- Popular Resources
- Popular amplifiers
-
 Introduction to Artificial Intelligence and Robotics (Murphy)
 -
 Advanced HDL Synthesis and SOC Prototyping:RTL Design Using Verilog
 -
 Low-Noise, High-Precision Linear Power Supply with Thermal Foldback Protection
 -
 A Two-Way Interleaved 7-b 2.4-GSs 1-Then-2 b/Cycle SAR ADC With Background Offset Calibration
- High signal-to-noise ratio MEMS microphone drives artificial intelligence interaction
- Advantages of using a differential-to-single-ended RF amplifier in a transmit signal chain design
- ON Semiconductor CEO Appears at Munich Electronica Show and Launches Treo Platform
- ON Semiconductor Launches Industry-Leading Analog and Mixed-Signal Platform
- Analog Devices ADAQ7767-1 μModule DAQ Solution for Rapid Development of Precision Data Acquisition Systems Now Available at Mouser
- Domestic high-precision, high-speed ADC chips are on the rise
- Microcontrollers that combine Hi-Fi, intelligence and USB multi-channel features – ushering in a new era of digital audio
- Using capacitive PGA, Naxin Micro launches high-precision multi-channel 24/16-bit Δ-Σ ADC
- Fully Differential Amplifier Provides High Voltage, Low Noise Signals for Precision Data Acquisition Signal Chain
- Innolux's intelligent steer-by-wire solution makes cars smarter and safer
- 8051 MCU - Parity Check
- How to efficiently balance the sensitivity of tactile sensing interfaces
- What should I do if the servo motor shakes? What causes the servo motor to shake quickly?
- 【Brushless Motor】Analysis of three-phase BLDC motor and sharing of two popular development boards
- Midea Industrial Technology's subsidiaries Clou Electronics and Hekang New Energy jointly appeared at the Munich Battery Energy Storage Exhibition and Solar Energy Exhibition
- Guoxin Sichen | Application of ferroelectric memory PB85RS2MC in power battery management, with a capacity of 2M
- Analysis of common faults of frequency converter
- In a head-on competition with Qualcomm, what kind of cockpit products has Intel come up with?
- Dalian Rongke's all-vanadium liquid flow battery energy storage equipment industrialization project has entered the sprint stage before production
- Allegro MicroSystems Introduces Advanced Magnetic and Inductive Position Sensing Solutions at Electronica 2024
- Car key in the left hand, liveness detection radar in the right hand, UWB is imperative for cars!
- After a decade of rapid development, domestic CIS has entered the market
- Aegis Dagger Battery + Thor EM-i Super Hybrid, Geely New Energy has thrown out two "king bombs"
- A brief discussion on functional safety - fault, error, and failure
- In the smart car 2.0 cycle, these core industry chains are facing major opportunities!
- The United States and Japan are developing new batteries. CATL faces challenges? How should China's new energy battery industry respond?
- Murata launches high-precision 6-axis inertial sensor for automobiles
- Ford patents pre-charge alarm to help save costs and respond to emergencies
- New real-time microcontroller system from Texas Instruments enables smarter processing in automotive and industrial applications
- Operational Amplifier Key Terms
- How does condensation water in dry sealed spaces occur?
- Several tips for drawing schematics
- How to protect your IP when connecting to cloud services? Microchip offers tips
- 【AT-START-F425 Review】 2. Development Environment Construction and Demo Examples
- Is anyone familiar with lithium battery protection IC? If I want to verify these parameters, is there a special instrument? It shouldn't be...
- Electronic engineers, how can we better embrace GaN? Participate in the survey to get a gift!
- EEWORLD University----UCD3138 Digital PWM (DPWM) Module
- A joke only programmers can understand
- Battery voltage detection simulation + program based on MSP430

 Introduction to Artificial Intelligence and Robotics (Murphy)


 京公网安备 11010802033920号