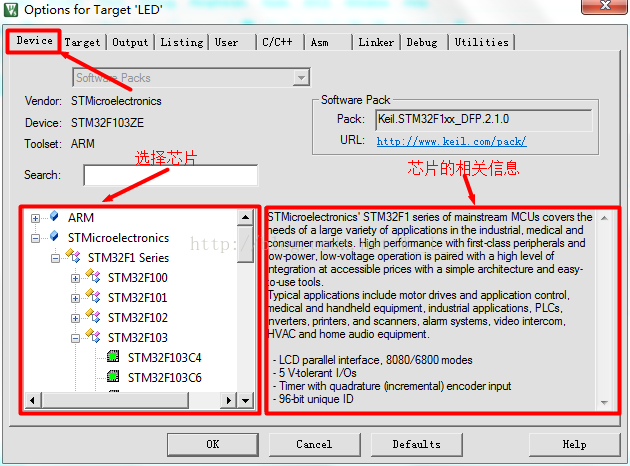
1. Click the magic wand pointed by the arrow to open the project settings. (You can also open the magic wand under Project)
2. Under the Device tab, select the chip used in the project. On the right is the relevant information about the selected chip (I use STM32F103ZET6, select STM32F103ZE)
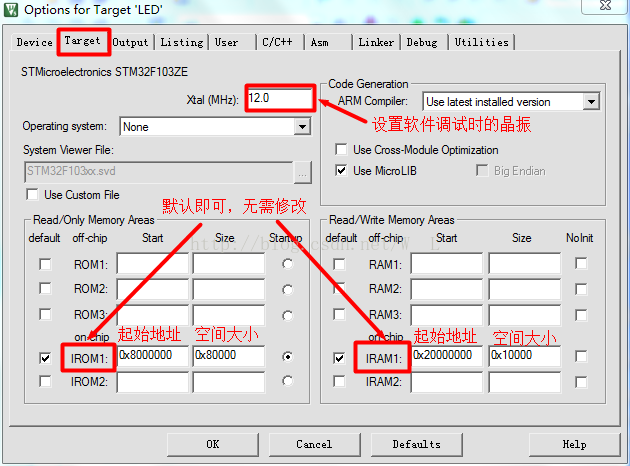
3. The crystal oscillator under the Target tab is related to software simulation. We download it to the hardware and then debug it without setting it. The starting address and size of ROM and RAM are as follows. They refer to the starting address and size of ROM and RAM of the actual hardware. The default is OK.
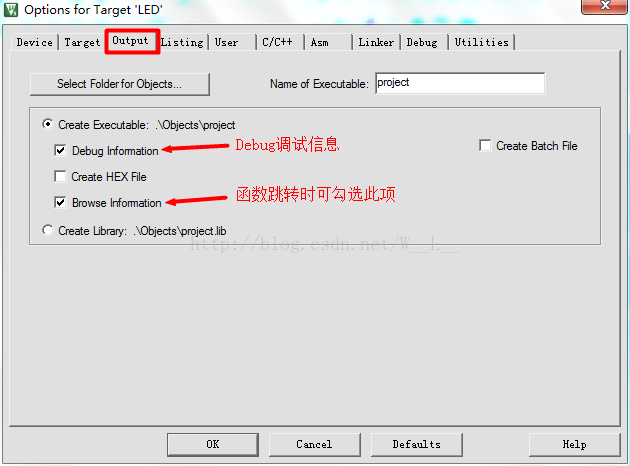
4. The Output tab is as follows, turn on Debug information and function jumps when reading code
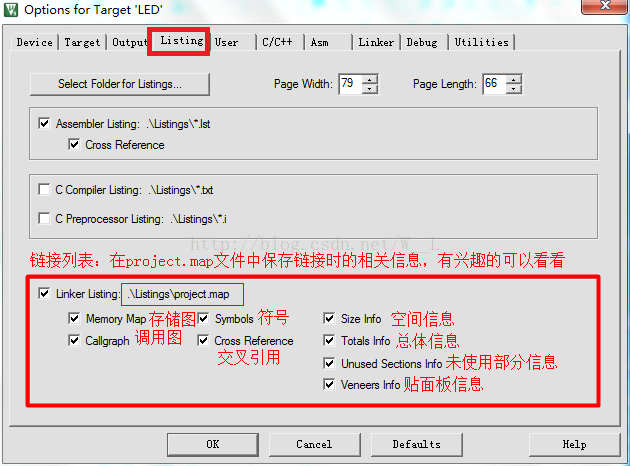
5. Under the Listing tab, select all the ones in the red box. The purpose is to record detailed information (in the project.map file) when the program is finally linked. My English is not very good, so some translations may not be very accurate.
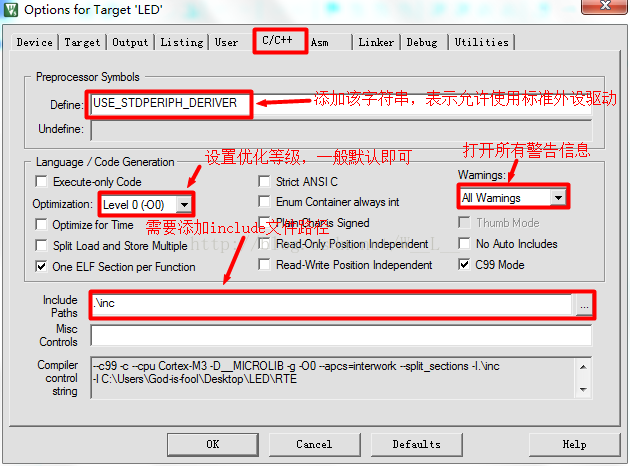
6. C/C++ tab:
The purpose of adding the USE_STDPERIPH_DERIVER string is to include the stm32f10x_conf.h header file (the string can be found in the stm32f10x.h file). The stm32f10x_conf.h header file contains the header files of the standard peripheral drivers. When you need to use a standard peripheral, you only need to add the corresponding macro definition.
The optimization level is usually set to the default level during normal debugging. It can be adjusted appropriately when the project is completed. It is best to turn on all warning messages during normal debugging. It is important to note the include file path at the bottom. You need to add all the header file paths used in the project (usually header files added by users themselves)
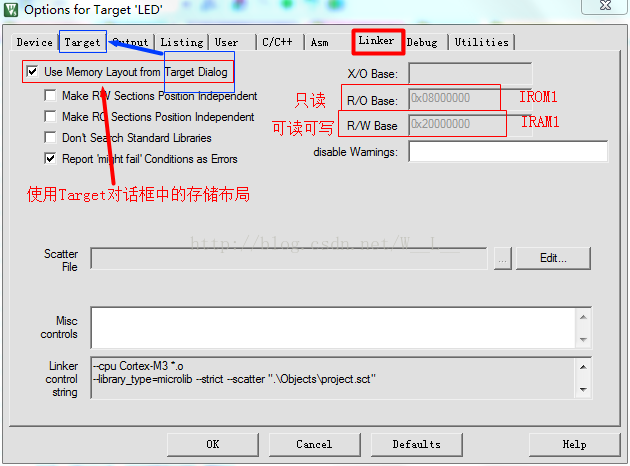
7. All the defaults in the Linker tab correspond to the settings in ROM and RAM in the previous Target tab.
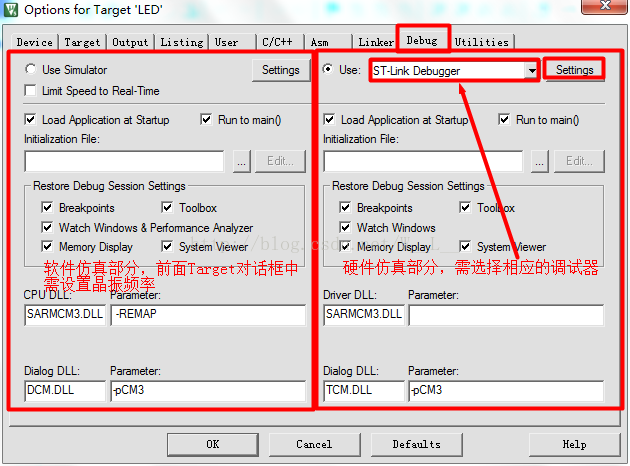
8. The left side of the Debug tab is software simulation, and the right side is hardware simulation (it is more appropriate to call it hardware debugging, which is mainly to correspond to the left side). Select the corresponding debugger in hardware debugging (I use ST-Link)
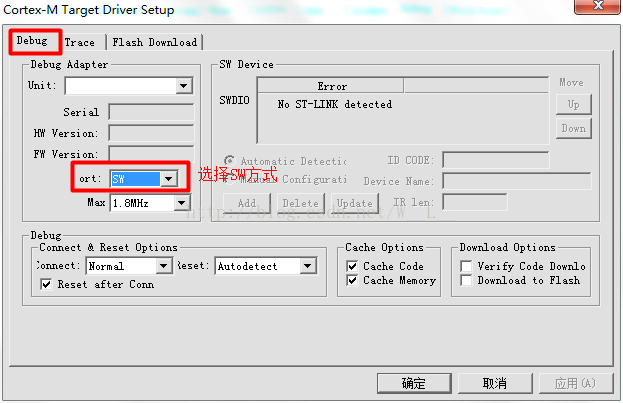
Click the Settings button in the hardware debugging section in the figure above, and a dialog box as shown below will pop up. Select SW mode under the Debug tab (note that it is the Debug tab in the dialog box that pops up after clicking Settings).
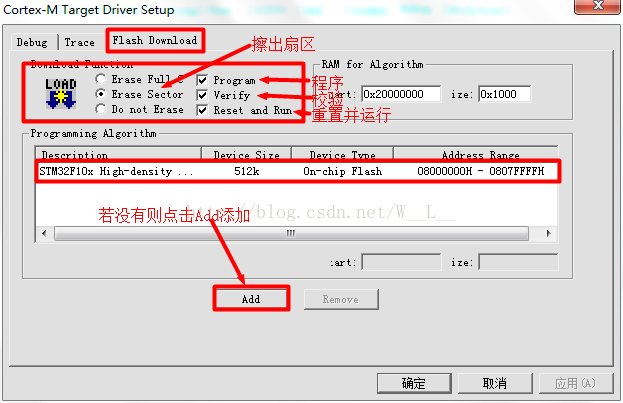
Select the Flash Download tab in the dialog box above, check and add as shown in the figure below.
At this point, all download-related settings have been completed. You only need to compile without errors or warnings to download the program to the STM32 chip.
Previous article:STM32F103ZET6 boot mode
Next article:STM32F4XX IO port clock multiplexing function
Recommended ReadingLatest update time:2024-11-15 13:28


- Popular Resources
- Popular amplifiers
-
 Network Operating System (Edited by Li Zhixi)
 -
 Microgrid Stability Analysis and Control Microgrid Modeling Stability Analysis and Control to Improve Power Distribution and Power Flow Control (
 -
 MATLAB and FPGA implementation of wireless communication
 -
 Introduction to Internet of Things Engineering 2nd Edition (Gongyi Wu)
- Learn ARM development(16)
- Learn ARM development(17)
- Learn ARM development(18)
- Embedded system debugging simulation tool
- A small question that has been bothering me recently has finally been solved~~
- Learn ARM development (1)
- Learn ARM development (2)
- Learn ARM development (4)
- Learn ARM development (6)
 Professor at Beihang University, dedicated to promoting microcontrollers and embedded systems for over 20 years.
- LED chemical incompatibility test to see which chemicals LEDs can be used with
- Application of ARM9 hardware coprocessor on WinCE embedded motherboard
- What are the key points for selecting rotor flowmeter?
- LM317 high power charger circuit
- A brief analysis of Embest's application and development of embedded medical devices
- Single-phase RC protection circuit
- stm32 PVD programmable voltage monitor
- Introduction and measurement of edge trigger and level trigger of 51 single chip microcomputer
- Improved design of Linux system software shell protection technology
- What to do if the ABB robot protection device stops
- Wi-Fi 8 specification is on the way: 2.4/5/6GHz triple-band operation
- Wi-Fi 8 specification is on the way: 2.4/5/6GHz triple-band operation
- Vietnam's chip packaging and testing business is growing, and supply-side fragmentation is splitting the market
- Vietnam's chip packaging and testing business is growing, and supply-side fragmentation is splitting the market
- Three steps to govern hybrid multicloud environments
- Three steps to govern hybrid multicloud environments
- Microchip Accelerates Real-Time Edge AI Deployment with NVIDIA Holoscan Platform
- Microchip Accelerates Real-Time Edge AI Deployment with NVIDIA Holoscan Platform
- Melexis launches ultra-low power automotive contactless micro-power switch chip
- Melexis launches ultra-low power automotive contactless micro-power switch chip
- Solution to TL570x-EVM-A2 development board device node operation not permitted
- National Technology N32 MCU RF Resource Library (official, practical information)
- Teach you to understand the role of resistors in circuits
- EEWORLD University Hall----High-efficiency power architecture for smart door locks, battery-free light switches and wireless sensors
- 【E840-DTU】TCP connection
- Tank-1 test stand description (for burning and testing ESP8266 series)
- How to implement software reset and restart on HGI MCU
- Understanding digital signal processing
- [SAMR21 New Gameplay] 10. Serial Port Communication-3
- Can you give me an example of how to read the development board data in real time via TCP protocol on PC?


 Network Operating System (Edited by Li Zhixi)


 京公网安备 11010802033920号