As a new generation of light source, LED has the advantages of adjustable light quantity and light quality, low cooling load and higher cultivation volume per unit area compared with artificial light sources such as fluorescent lamps or high-pressure sodium lamps commonly used in the current agricultural field. It is a very suitable artificial light source for closed and environmentally controlled agricultural production environments, such as plant tissue culture rooms. It is very important to accurately monitor and control the light environment parameters for plant growth in greenhouses. In order to achieve accurate detection and intelligent control of light environment parameters, a greenhouse light environment monitoring and control system (hereinafter referred to as "monitoring and control system") based on LED light source was proposed and designed on the basis of demand analysis. The system can accurately monitor and control its light environment.
1 Monitoring demand analysis
The ideal operating temperature of LED is usually 25℃. At this temperature, the luminous intensity has a maximum value. As the temperature rises, the conduction current will increase accordingly. The short-term effect of overheating is color drift, which is irreversible. The long-term effect of overheating is a permanent reduction in luminous intensity and LED life. In order to meet the demand for monitoring and controlling greenhouse light environment parameters, combined with the relationship between plants and LED light sources, the main parameters of light environment monitoring and control are analyzed: the illuminance signal of LED light sources, the central temperature of light source panels and other signals. To complete the monitoring and control of signals, we must start from three aspects: first, the monitoring and control system should be able to collect input parameters in various conditions, and detect the output signal of the system to determine whether the greenhouse works as required in various states; second, it should be able to communicate the detected data with the PC; third, it should also have the function of displaying and storing data, and controlling the light environment of the greenhouse after processing the data.
2 Overall Design
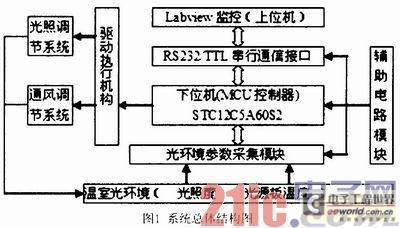
The structure of this monitoring and control system is shown in Figure 1. The system is mainly composed of three parts: the host computer, the MCU data acquisition unit and the actuator. In the process of monitoring the light environment parameters of the greenhouse, the temperature and illuminance of the light source panels in the greenhouse are detected in real time through various sensors to monitor whether the parameters are normal. The collected data is converted and sent to the microcontroller to complete the data collection: the STC12C5A60S2 microcontroller is the core controller, the PC and Labview software are used as monitoring modules, the two communicate through the RS232 serial port, and with the help of greenhouse environmental data (illuminance, central temperature of the LED light source board), a monitoring and control system for the greenhouse light environment is constructed.
3 System Hardware Design
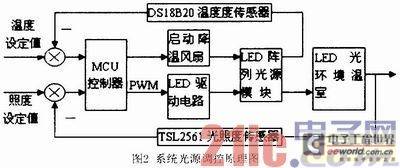
The monitoring system hardware mainly consists of RS232 serial communication interface circuit, STC12C5A60S2 controller, LED array light source module, LED drive circuit, DS18B20 light source board temperature acquisition circuit and TSL2561 light intensity parameter acquisition circuit. In order to realize the greenhouse light environment control, it is necessary to automatically collect the greenhouse light intensity and LED temperature in real time and feed them back to the controller. The controller adjusts the duty cycle of the LED drive circuit PWM according to the set value of illumination, and then adjusts the forward current flowing through the LED, so that the greenhouse light intensity is approximately equal to the set value, and finally achieves illumination control. At the same time, the controller compares the temperature value fed back by the light source board with the set value, and starts the cooling fan when the temperature exceeds the set value. The principle of system LED light environment control is shown in Figure 2.
3.1 LED array light source board
Ideally, the light intensity distribution of a single LED light source is a cosine function of the observation angle. In fact, due to the packaging and chip shape, the light intensity distribution of the LED is not an ideal cosine distribution. The distribution can be expressed as formula (1). The actual approximate distribution of the illuminance should be formula (2):
![]()
In formulas (1) and (2), θ is the observation angle, I0 (unit: cd) represents the maximum light intensity in the normal direction, and E0 (unit: Lx) is the illuminance value at a distance r from the axial direction to the LED. The value of m is a constant (see the LED technical manual). The
illuminance of the LED array is obtained by linearly superposing the illuminances of multiple LEDs. Modify the illuminance formula (2) in the coordinate system (x, y, z), set the distance between the target and the light source to z, and the illuminance E of a single LED in space can be expressed by formula (3).

In the case of an array consisting of two LEDs, if the LED spacing is d, the illuminance on the target surface is shown in formula (4).
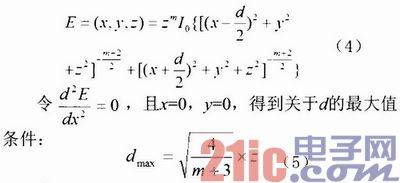
When z = 1 cm and m = 81, substituting into formula (5) yields dmax = 0.218 cm. To ensure that the illumination is relatively uniform, the maximum value of the distance d between two LEDs is 0.218 cm. Therefore, the LED array light source design can choose this value as the distance between each LED, and multiple LEDs can be combined into a square array to complete a relatively uniform light source design.
3.2 Illuminance and light source board center temperature detection circuit
The detection circuit in this article uses the TSL2561 light sensor chip and the DS18B20 temperature sensor to complete the data collection of the illumination and the center temperature of the light source. The hardware circuit is shown in Figure 3.

TSL2561 is a light intensity sensor chip with a digital output port and a standard I2C bus interface, covering a wide illumination range of 1 to 70,000 Lx. Its internal channels 0 and 1 are two photodiodes, of which channel 0 is sensitive to both visible light and infrared, while channel 1 is only sensitive to infrared. The integrating A/D converter integrates the current flowing through the photodiode and converts it into a digital quantity. After the conversion is completed, the conversion result is stored in the respective registers of channel 0 and channel 1 inside the chip. When the conversion is completed, the corresponding values CH0 and CH1 are read from the channel 0 register and channel 1 register to calculate the illuminance Lx.
DS18B20 is a temperature sensor, and its internal structure mainly consists of four parts: 64-bit photolithography ROM, temperature sensor, non-volatile temperature alarm trigger TH and TL configuration register. The temperature sensor in DS18B20 can complete the measurement of temperature, and is provided in the form of 12-bit converted to 16-bit sign-extended binary complement reading, expressed in the form of 0.0625℃/LSB, where S is the sign bit. According to the communication protocol of DS18B20, the microcontroller is strictly controlled according to the timing of DS18B20 to complete the measurement of the center temperature of the light source board.
3.3 LED drive circuit
The lumen efficiency (ηe) of LED light source refers to the lumen luminous flux generated by each watt of input electrical power, and the unit of measurement is 1m/W. The calculation formula is shown in formula (6):
![]()
Where: ηe is the lumen efficiency, φ1um is the luminous flux, U is the LED forward voltage, and I is the LED forward current.
Illuminance (E) refers to the illuminance generated by 1 lumen of luminous flux evenly distributed on a surface of 1m2, and the unit is lux (Lx). The calculation formula is shown in formula (7): 
It can be seen that the brightness of the LED is almost directly proportional to its driving current, and the brightness of the LED can be adjusted by adjusting the size of the forward driving current.
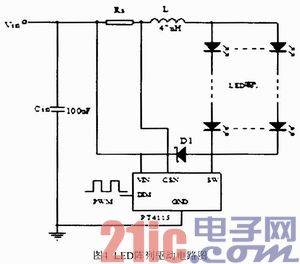
The LED array adopts constant current drive mode, and the LED can obtain constant color output. The system selects PT4115 constant current driver chip, and the drive circuit is shown in Figure 4. PT4115 is a step-down constant current source in continuous inductive current conduction mode. It has a wide input voltage range of 8V to 30V DC, a breakdown voltage greater than 45V, and outputs 200~1200mA constant DC, which can meet the needs of driving and lighting N series-parallel low-power LEDs. PT4115 has a built-in power switch, uses high-end current sampling to set the average current of the LED, and can accept analog dimming and a wide range of PWM dimming through the DIM pin. When the voltage of DIM is lower than 0.3V, the power switch is turned off, and PT4115 enters a standby state with extremely low operating current. The maximum average current of the LED is determined by the resistor RS connected between VIN and CSN. By adding a PWM signal with a variable duty cycle to the DIM pin, the output current can be reduced to achieve dimming. The calculation method is shown in formula (9):
![]()
Where D is the duty cycle of PWM, Vpilse is the high level value of PWM, and Rs is the current limiting resistor.
3.4 Controller algorithm design and implementation
STC12C5A60S2 is used as the main controller. The chip has two PWM controllers, two timers, and a ten-bit AD converter. The system light intensity adjustment uses an incremental PID algorithm. The values of PWM timers CCAP1L and CCAP1H are adjusted proportionally according to the conversion amount, and PWM signals with different duty cycles are output to adjust the LED illumination. The PID is as shown in formula (10)
△uk=Aek-Bek-1+Cek-2 (10)
Where: △uk is the increment of the control amount; k is the sampling sequence number; ek is the input deviation value of the kth sampling; ek-1 is the input deviation value of the k-1th sampling.
There are two states for illuminance adjustment: 1) If the current value is less than the input set value, the PWM waveform duty cycle increases, and the output illuminance increases until the output value is equal to the set value. 2) If the output value is greater than or equal to the set value, the PWM output duty cycle decreases, and the output illuminance decreases until the output value is equal to the set value. Through continuous detection and adjustment, the illuminance is kept constant.
The temperature of the LED light source board is detected by the temperature sensor. When the detected temperature is higher than the set temperature, the cooling fan is started. When the detected temperature is lower than or equal to the set temperature, the cooling fan is stopped.
4 System software design
4.1 Upper computer software design
The software of this monitoring system is programmed using Labview. Labview is a graphical programming environment designed for data acquisition, instrument control, data analysis and data expression. It is an open development environment with all functional functions of various instrument communication bus standards such as PCI, RS-232/485, USB, etc. These functions can be used to interact with data acquisition hardware with different bus standard interfaces. This system uses NI VISA serial port Serial function to access and control the serial port, thereby realizing serial port communication function. First, use VISA ConnectSerial Port.vi to initialize the serial port, then use VISA write.vi to send data read instructions to the write buffer, and finally use VISAread.vi to read the 8-bit binary number in the data buffer in the form of a string, and use the HexadecimalString To Number node to convert the 8-bit string data into digital data and provide it to the control circuit. Figure 5 is a
partial block diagram of the handshake protocol subVI program of the host computer Labview software.
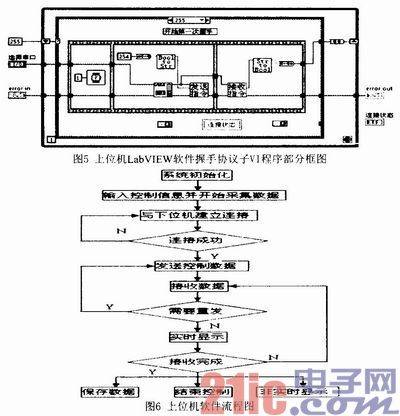
The upper computer software completes the following functions: initialize the system; send control instructions to the lower computer according to the greenhouse control requirements; control the serial port and the lower computer's transmission and reception; judge the lower computer data acquisition status and send corresponding control instructions; read and analyze the data from the lower computer; display real-time or non-real-time data; save data; control the system status according to environmental requirements. Figure 6 is the upper computer software flow chart.
4.2 Lower computer software design
The lower computer software is written in C51 language. The functions completed are: control the lower computer's light environment parameter acquisition and given values of environmental parameters according to the upper computer control instructions; send environmental parameters to the upper computer; adjust the light environment according to environmental parameters and set values. The lower computer software flow is shown in Figure 7.

5 Experimental application
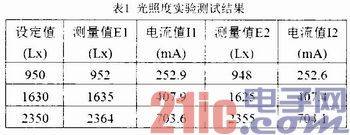
This system is used to test the light intensity of a simple greenhouse. When conducting the test, first run the monitoring application software. After initialization, complete the relevant settings such as detection settings and communication configuration, and then click the corresponding module detection button on the main program interface to conduct the corresponding test. The upper computer sends the control command word and then receives the data sent back by the lower computer; and displays the results. The data of the light intensity test of 2 series of 1W red light array light sources in series and parallel are shown in Table 1. The experimental results show that the greenhouse illumination is stable around the set value, and the dimming system basically maintains the stability of the set illumination.
6 Conclusion
The LED light source environment monitoring and control system designed in this paper can not only collect and display greenhouse environmental parameters in real time, but also realize remote control of data, which can meet the monitoring and control requirements of the system. This test system has been tested in a simple greenhouse system. Practical application shows that it has the characteristics of accurate detection, stable and reliable, and friendly human-computer interface, meeting the design requirements. Moreover, after the system is expanded, it can be used for remote data monitoring and measurement and control of multiple light source board workstations.
Previous article:Design and application of edge-lit LED backlight technology
Next article:What are the differences between new OLED materials that do not use rare metals and existing materials?
- Popular Resources
- Popular amplifiers
- MathWorks and NXP Collaborate to Launch Model-Based Design Toolbox for Battery Management Systems
- STMicroelectronics' advanced galvanically isolated gate driver STGAP3S provides flexible protection for IGBTs and SiC MOSFETs
- New diaphragm-free solid-state lithium battery technology is launched: the distance between the positive and negative electrodes is less than 0.000001 meters
- [“Source” Observe the Autumn Series] Application and testing of the next generation of semiconductor gallium oxide device photodetectors
- 采用自主设计封装,绝缘电阻显著提高!ROHM开发出更高电压xEV系统的SiC肖特基势垒二极管
- Will GaN replace SiC? PI's disruptive 1700V InnoMux2 is here to demonstrate
- From Isolation to the Third and a Half Generation: Understanding Naxinwei's Gate Driver IC in One Article
- The appeal of 48 V technology: importance, benefits and key factors in system-level applications
- Important breakthrough in recycling of used lithium-ion batteries
- LED chemical incompatibility test to see which chemicals LEDs can be used with
- Application of ARM9 hardware coprocessor on WinCE embedded motherboard
- What are the key points for selecting rotor flowmeter?
- LM317 high power charger circuit
- A brief analysis of Embest's application and development of embedded medical devices
- Single-phase RC protection circuit
- stm32 PVD programmable voltage monitor
- Introduction and measurement of edge trigger and level trigger of 51 single chip microcomputer
- Improved design of Linux system software shell protection technology
- What to do if the ABB robot protection device stops
- Huawei's Strategic Department Director Gai Gang: The cumulative installed base of open source Euler operating system exceeds 10 million sets
- Download from the Internet--ARM Getting Started Notes
- Learn ARM development(22)
- Learn ARM development(21)
- Learn ARM development(20)
- Learn ARM development(19)
- Learn ARM development(14)
- Learn ARM development(15)
- Analysis of the application of several common contact parts in high-voltage connectors of new energy vehicles
- Wiring harness durability test and contact voltage drop test method
- The "GaN-do" attitude of the network
- Industry Consulting
- Problems with the ping command
- About LoRa networking issues?
- Comparison of MC34063 circuit structures
- [Evaluation and experience of Zhongke Yihaiwei EQ6HL45 development platform] + Create a new FPGA project——ehiway_fpga_test0
- z I have a humble question. How many degrees should the serial numbers on the PCB assembly drawing be flipped?
- The board for showing goods + collecting dust
- TLC5620 driver design based on FPGA (DA).pdf
- TMS320VC5509 on-chip ADC acquisition

 TL061MFH


 京公网安备 11010802033920号