I. Overview
With the continuous development of science and technology, the analysis of signal spectrum is indispensable in aerospace, aviation, navigation, communication and other fields. Spectrum analyzer is mainly used for spectrum analysis, and can also measure frequency, level, attenuation, modulation, distortion, jitter, etc. It is also widely used in communication, radar, navigation, electronic countermeasures, space technology, satellite ground station, frequency management, signal monitoring, EMI diagnosis, EMC measurement and other aspects. It is an essential instrument for scientific research, production, testing, experimentation and measurement of military electronic components and military complete systems.
2. Composition and working principle of spectrum analyzer
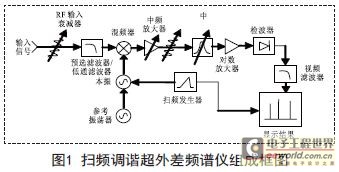
Figure 1 shows the block diagram of a swept-frequency tuned superheterodyne spectrum analyzer. The input signal is passed through an attenuator to limit the signal amplitude, a low-pass input filter to filter out unwanted frequencies, and then a mixer to mix with the local oscillator (LO) signal to convert the input signal to an intermediate frequency (IF). The frequency of the LO is controlled by a swept-frequency generator. As the LO frequency changes, the output signal of the mixer (which includes the two original signals, their sum, difference, and harmonics) is filtered out by a resolution bandwidth filter to remove the intermediate frequency of the local oscillator that is higher than the input signal, and is amplified or compressed on a logarithmic scale. The signal that passes through the IF filter is then rectified by a detector to obtain a DC voltage that drives the vertical portion of the display. As the swept-frequency generator sweeps across a certain frequency range, a trace is drawn on the screen. The trace shows the frequency components of the input signal within the displayed frequency range.

3. Functions of each part of the spectrum analyzer and display signal analysis
Input attenuator: ensures that the spectrum analyzer maintains good matching characteristics over a wide frequency range to reduce mismatch errors; protects the mixer and other intermediate frequency processing circuits to prevent component damage and excessive nonlinear distortion.
Mixer: Completes the spectrum shift of the signal and converts the input signals of different frequencies to the corresponding intermediate frequencies. In the low frequency band (<3GHz), high frequency mixing and low-pass filters are used to suppress image interference; in the high frequency band (>3GHz), bandpass tracking filters are used to suppress image interference.
Local Oscillator (LO): It is a voltage controlled oscillator whose frequency is controlled by a swept frequency generator. Its frequency stability is phase locked to a reference source.
Sweep generator: In addition to controlling the local oscillator frequency, it can also control the horizontal deflection display. The sawtooth wave sweep makes the spectrum analyzer screen display the signal from left to right, and then repeats this sweep to continuously update the trace. The sweep width (Span) is the frequency difference from the left fstart to the right fstop 10 grids, for example: Span = 1MHz, then 100kHz/div.
IF amplifier: Its gain and attenuator setting values work in conjunction, that is, when the input attenuation is 10dB, the IF gain increases by 10dB at the same time, so that the input signal level remains unchanged. The reference level of the top grid of the screen indirectly sets the IF gain value. When the reference level ↑ (or ↓) is 10dB, the gain ↓ (or ↑) causes the signal to ↓ (or ↑) shift by 10dB, that is, the signal display position is changed, but the signal amplitude remains unchanged. When the input attenuation increases by 10dB, the signal-to-noise ratio decreases by 10dB. This is because the input attenuation is before the mixer and only attenuates the signal level, while the noise is generated after mixing. In order to ensure that the input signal level remains unchanged, the mixed signal must be amplified by 10dB accordingly, so the noise is also amplified accordingly, that is, the noise level increases by 10dB.
Intermediate frequency filter: also known as resolution bandwidth filter, used to distinguish signals of different frequencies. It only allows the difference frequency of the local oscillator signal minus the input signal to equal the intermediate frequency, so that it can pass through the intermediate frequency filter and finally be displayed on the screen. Other interference signals will be suppressed.
The 3dB bandwidth of the intermediate frequency filter is also called the resolution bandwidth (RBW). The reason why the signal cannot be displayed as an infinitely thin line on the spectrum analyzer, but has a certain width, is that when the signal is tuned through, its shape is the display of the resolution bandwidth (IF filter) shape of the spectrum analyzer itself. When the RBW is changed, the width of the displayed response is changed.
The smaller the RBW, the higher the frequency resolution. If the RBW is reduced by 10 times, the noise energy reaching the detector will be reduced by 10 times, and the displayed average noise level will be reduced by 10dB, and vice versa. Noise level change ΔdB = 10log(RBWnew/RBWold) = 10log(1kHz/10kHz) = -10dB.
Detector: It converts the input signal power into an output video voltage, which corresponds to the input signal power. When the spectrum analyzer sweep width Span = 0, the envelope detector will demodulate the input signal and display the signal envelope waveform as a receiver operating at the center frequency (CF) and bandwidth RBW (time domain mode).
Video filter: smooths out noise in the display.
It performs low-pass filtering and averaging on the detector output video signal to smooth the display. Reducing the video bandwidth (VBW) can smooth the noise jitter in the spectrum display, thereby reducing the range of display jitter. This helps the spectrum analyzer to find low-power continuous wave (CW) signals submerged in noise and improves the repeatability of measurements.
Display: Equivalent to the speaker in an AM radio. The amplitude of each frequency we see is exactly the amplitude of each frequency we hear when we tune into an AM radio. The signal is displayed in the frequency domain as a rotating vector. The length of the vector = the peak amplitude of the sine wave. The position of the vector on its frequency axis = the frequency of the signal.
4. AM Signal Measurement and Analysis
The characteristic of the amplitude modulated wave is that the envelope of the carrier amplitude changes with the modulation signal, and its carrier frequency fC remains unchanged. The amplitude modulated signal is expressed as U(t)=AC[1+macos(2πfmt)]
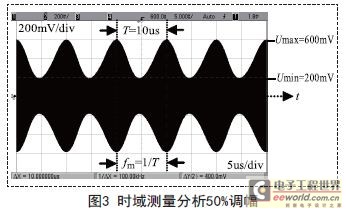
cos(2πfct)(4-1). Where Ac = constant that determines the total signal amplitude; ma = amplitude modulation depth (0≤ma≤1); cos(2πfmt) = normalized modulation signal, fm = modulation frequency; AC[1+macos(2πfmt)] determines the amplitude of the carrier envelope. fc = carrier frequency. In the time domain, the waveform of a carrier with sinusoidal amplitude modulation is shown in Figure 3. The signal envelope change is the modulation signal, so the analysis of the envelope waveform can reflect the amplitude modulation parameters. The minimum and maximum values of the waveform envelope are called Umin and Umax.
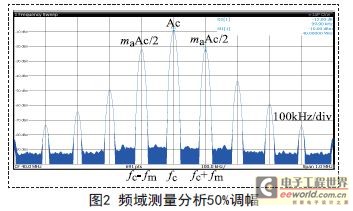
The amplitude modulation coefficient ma can be calculated from these two parameters. When the modulated sine wave is at its maximum positive and negative values, i.e. ±1, the maximum envelope voltage Umax=1+ma and the minimum envelope voltage Umin=1-ma will appear. The amplitude modulation coefficient ma=(Umax-Umin)/(Umax+Umin)(4-2) or ma=(1-Umin/Umax)/(1+Umin/Umax)(4-3) is obtained. Expanding equation (4-1) yields equation U(t)=Accos(2πfct)+maAc/2[cos2π(fc+fm)t+cos2π(fc-fm)t](4-4). It can be seen that in the frequency domain, the amplitude modulated signal U(t) consists of a carrier with an amplitude of Ac and two sidebands; one is at fc+fm and the other is at fc-fm, both with an amplitude of maAc/2, and the spectrum is shown in Figure 2. The modulation frequency fm is the frequency difference between the carrier and one of the sidebands (the sidebands are symmetrical with respect to the carrier). The amplitude difference corresponds to the amplitude modulation coefficient ma. That is, the sideband amplitude relative to the carrier is expressed in dB as dBc=20log(ma/2), then ma=2×10dBc/20.[page]

5. Example of AM Signal Measurement
A spectrum analyzer can be used to characterize AM signals in both the frequency and time domains. The parameters that can be measured are the carrier amplitude and frequency, the modulation frequency, and the amplitude modulation factor.
Set the signal source output carrier frequency fc=400MHz, carrier amplitude 0dBm; modulation frequency fm=100kHz (period T=10us), amplitude modulation coefficient ma=50%. Connect the signal source output to the spectrum analyzer input to measure the amplitude modulation signal. The spectrum analyzer settings are as follows:
(1) Press [Reset]; (2) [Frequency], [Center Frequency], 400 [MHz]; (3) [Amplitude], [Reference Level], 0 [dBm]; (4) [Sweep Width], [Bandwidth], 1 [MHz]; The frequency domain characteristics of the AM signal are (5) [Peak Search], Mark the carrier signal; (6) [Frequency Marker], [ΔFrequency Marker], move the marker to the modulation sideband frequency position, and the frequency difference Δf = fm = 100 kHz can be measured. z, the amplitude difference of the sideband relative to the carrier is dBc = -12.04dB, and the amplitude modulation coefficient ma = 2×10dBc/20 = 2×10-12.04/20 = 50%. The time domain characteristics of the AM signal are (7) Press [Sweep Width], [Bandwidth: Zero Bandwidth]; (8) [Bandwidth], [RBW: Manual], 3[MHz]; [VBW: Manual], 3[MHz]; (9) [Amplitude], [Linearity], [Reference Level], [↑][↓]; adjust the reference level so that the signal is located in the center of the display. (10) [Sweep], [Sweep Time:
Manual], 1 0 0 [ us ]; ( 1 1 ) [Trigger], [Video], [↑][↓] adjust the trigger level to make the signal display stable. (12) [Frequency Marker], [Normal Frequency Marker], measure the envelope peak value, [Δ Frequency Marker] turn on relative measurement, measure the envelope peak-peak value. Move the marker to the adjacent peak-peak value, and the modulation signal period T = 10 us can be measured, then fm = 1 / T = 1 0 0 kHz. Move the marker to the adjacent peak-minimum value, and the linear amplitude ratio Umin/Umax = 0.333 can be measured. Substituting it into formula (4-3) can calculate the amplitude modulation coefficient ma = (1-0.333)/(1+0.333) = 1/2 = 50%.
It can also be seen from the time domain amplitude modulation wave in Figure 3 that the waveform envelope Umax=600mV, Umim=200mV, substituting it into formula (4-2), we get ma=(600-200)/(600+200)=1/2=50%.

VI. Conclusion
The spectrum analyzer can measure the amplitude modulated signal in both the frequency domain and the time domain. By explaining the working principle of the spectrum analyzer and the measurement signal analysis, you can correctly understand, use, operate and apply the spectrum analyzer. Due to space limitations, only the amplitude modulated signal is measured and analyzed. The spectrum analyzer can also measure and analyze the frequency, power, bandwidth, modulation and other parameters of various types of signals such as harmonic distortion, third-order intermodulation, stimulus response, phase noise, etc.
Previous article:Research and development of a multifunctional electronic tester for automobile generator voltage regulator
Next article:Design and performance test of a high-efficiency flyback switching power supply
- Popular Resources
- Popular amplifiers
- Keysight Technologies Helps Samsung Electronics Successfully Validate FiRa® 2.0 Safe Distance Measurement Test Case
- From probes to power supplies, Tektronix is leading the way in comprehensive innovation in power electronics testing
- Seizing the Opportunities in the Chinese Application Market: NI's Challenges and Answers
- Tektronix Launches Breakthrough Power Measurement Tools to Accelerate Innovation as Global Electrification Accelerates
- Not all oscilloscopes are created equal: Why ADCs and low noise floor matter
- Enable TekHSI high-speed interface function to accelerate the remote transmission of waveform data
- How to measure the quality of soft start thyristor
- How to use a multimeter to judge whether a soft starter is good or bad
- What are the advantages and disadvantages of non-contact temperature sensors?
- LED chemical incompatibility test to see which chemicals LEDs can be used with
- Application of ARM9 hardware coprocessor on WinCE embedded motherboard
- What are the key points for selecting rotor flowmeter?
- LM317 high power charger circuit
- A brief analysis of Embest's application and development of embedded medical devices
- Single-phase RC protection circuit
- stm32 PVD programmable voltage monitor
- Introduction and measurement of edge trigger and level trigger of 51 single chip microcomputer
- Improved design of Linux system software shell protection technology
- What to do if the ABB robot protection device stops
- Allegro MicroSystems Introduces Advanced Magnetic and Inductive Position Sensing Solutions at Electronica 2024
- Car key in the left hand, liveness detection radar in the right hand, UWB is imperative for cars!
- After a decade of rapid development, domestic CIS has entered the market
- Aegis Dagger Battery + Thor EM-i Super Hybrid, Geely New Energy has thrown out two "king bombs"
- A brief discussion on functional safety - fault, error, and failure
- In the smart car 2.0 cycle, these core industry chains are facing major opportunities!
- The United States and Japan are developing new batteries. CATL faces challenges? How should China's new energy battery industry respond?
- Murata launches high-precision 6-axis inertial sensor for automobiles
- Ford patents pre-charge alarm to help save costs and respond to emergencies
- New real-time microcontroller system from Texas Instruments enables smarter processing in automotive and industrial applications
- Urgently looking for chip model
- ESP32-S3 KORVO-2 2.4'' ARDUINO TFT Unboxing Report
- A troubleshooting example of connecting XDS100V3 debugging target board with CCS
- 【Android Development Learning Road】Part 2-- HelloEEWorld
- 51 MCU library serial port sends a segment of characters and the digital tube receives and displays them (use the serial port debugging assistant to modify the data)
- pic18F27Q10 eeprom erase problem
- 【BearPi-HM Micro】Part 4: Familiar with the Openharmomy compilation framework and serial port interactive output
- 50 ways to use TI CC6678 digital signal processor (DSP)
- Definition of Direct Current and Alternating Current
- [Reference Book] PCB Design Tips (ADI Think Tank)

 5962-8767401CX


 京公网安备 11010802033920号