to think of the active filter as two cascaded filters. As shown in Figure 1, one of the filters is an ideal filter that represents the transfer function, and the other is the amplifier that forms the filter. The amplifier used in the closed negative feedback loop can be thought of as a simple low-pass filter with a first-order response. Above a certain point, the gain will roll off with increasing frequency. In addition, if the amplifier is an inverting amplifier, an additional 180° phase shift will appear at all frequencies.
Figure 1. Filter represented as two cascaded transfer functions
The filter design process can be divided into two steps. First, the filter response is selected, and then the appropriate circuit structure is selected to implement it. The response of a filter is the shape of its rolloff curve, which is often classified as one of the classic response characteristics, such as Butterworth, Bessel, or some Chebyshev type. While the choice of these response characteristics often affects the amplitude response characteristics, they also affect the shape of the phase response characteristics. In this article, for the sake of comparison, the amplitude response is ignored and assumed to be almost unchanged.
The complexity of a filter is often defined by the "order" of the filter, which is related to the number of energy storage elements (inductors and capacitors). The order of the denominator of the filter transfer function defines the rate of rolloff as frequency increases. Asymptotic filters roll off at a rate of -6ndB/octave, or -20ndB/decade, where n is the number of poles. An octave is a doubling or halving of the frequency, and a decade is a tenfold increase or decrease in frequency. Therefore, a first-order (or single-pole) filter has a roll-off rate of -6dB/octave or -20dB/decade. Similarly, a second-order (or 2-pole) filter has a roll-off rate of -12dB/octave or -40dB/decade. Higher-order filters are often constructed by cascading first- and second-order building blocks. Naturally, third- and even fourth-order filters can be constructed from a single active amplifier stage, but the sensitivity to component values and the large increase in the frequency response due to component interactions make these options less attractive.
Transfer Function
First, let's examine the phase response of the transfer function. For filter options of the same order, the phase shift characteristic of their transfer functions is the same.
For the single-pole, low-pass case, the phase shift of the transfer function is φ, given by the following equation.
 (
1
)
(
1
)
Where:ω = frequency (radians/second)
ω0
= center frequency (radians/second)
Frequency in radians/second is equal to 2π times frequency in Hz, since each 360° period corresponds to 2π radians. Since the above expression is a dimensionless ratio, both f and ω can be used.
The
center frequency is also called the cutoff frequency (the frequency at which the amplitude response of this single-pole, low-pass filter drops by 3dB, about 30%). In terms of phase relationships, the center frequency is the frequency at which the phase shift reaches 50% of its final value, –90° (in this example). Figure 2 is a semi-logarithmic plot that illustrates the phase response relationship described by Equation 1, from two decades below the center frequency to two decades above the center frequency. The phase shift at the center frequency (=1) is –45°.
Figure 2. Phase response of a single-pole, low-pass filter around center frequency (in-phase, left axis; inverted response, right axis) Figure: Normalized Frequency, Phase Angle (in-phase), Phase Angle (inverted) Similarly
, a single-pole, high-pass filter can be given by:

 (2)
(2)
Figure 3 depicts the response characteristics expressed by Equation 2 over the range of two decades below the center frequency to two decades above the center frequency. The normalized phase shift at the center frequency (=1) is +45°. Obviously
, the high-pass and low-pass characteristics are similar, except that there is a 90° phase difference (π/2 radians) between them.

Figure 3. Phase response of a single-pole, low-pass filter near the center frequency 1 (in-phase, left axis; inverted response, right axis) In the figure: Normalized Frequency, Phase Angle (in-phase), Phase Angle (inverted)
For the second-order, low-pass case, the phase shift of the transfer function can be approximated by the following equation:
 (3)
(3)
Where α is the damping ratio of the filter. It determines the peak in the amplitude response and the steepness of the phase transition. It is the inverse of the circuit’s Q, which determines the steepness of the amplitude roll-off or phase shift. The Butterworth response has an α of 1.414 (Q = 0.707), which produces a maximally flat response. Lower αs will produce peaks in the amplitude response.

Figure 4. Phase response of a two-pole, low-pass filter around center frequency 1 (in-phase, left axis; inverted response, right axis) Figure: Normalized Frequency, Phase Angle (in-phase), Phase Angle (inverted)
Figure 4 depicts the response represented by this equation (α = 1.414) from two decades below center frequency to two decades above center frequency. Here, the phase shift at center frequency (= 1) is –90°. The phase response of a 2-pole, high-pass filter can be approximated by the following equation:
 (4)
(4)
Figure 5 depicts the response characteristic represented by this equation (again with α = 1.414) from two decades below the center frequency (=1) to two decades above the center frequency, with the corresponding phase shift being
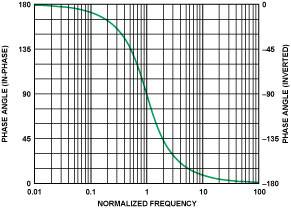
Figure 5. Phase response of a two-pole, high-pass filter around center frequency 1 (in-phase, left axis; inverted response, right axis) Figure: Normalized Frequency, Phase Angle (in-phase), Phase Angle (inverted)
Again, it is clear that the high-pass and low-pass phase responses are similar, with only a 180° phase shift (π radians). In higher-order filters, the phase response of each additional segment is added to the total phase shift. This feature is discussed further below. In keeping with common practice, the phase shifts shown are limited to ±180°. For example, –181° is actually equivalent to +179°, 360° is equivalent to 0°, and so on.
First-Order Filter Sections
First-order filter sections can be constructed in a variety of ways. Figure 6 shows the simplest configuration, using a passive R-C architecture. The center frequency of this filter is 1/(2πRC). It is often followed by a buffer amplifier in phase to prevent the circuitry after the filter from loading it, which would change the filter response. In addition, the buffer can provide some drive capability. The phase response is shown in Figure 2, which shows a 45° phase shift at the center frequency, as predicted by the transfer function, because there are no additional components to change the phase shift. This response will be called an in-phase, first-order, low-pass response. As long as the buffer bandwidth is significantly higher than the filter, the buffer will not introduce a phase shift.

Figure 6. Passive Low-Pass Filter
Remember that the frequency values in these graphs are normalized, that is, ratios relative to the center frequency. For example, if the center frequency is 5kHz, these graphs will show the phase response from 50Hz to 500kHz.
Figure 7 shows an alternative configuration. This circuit adds a shunt resistor to continuously discharge the integrating capacitor, essentially making it a lossy integrator. The center frequency is also 1/(2πRC). Because the amplifier is operating in the inverting mode, the inverting mode introduces an additional 180° phase shift in the phase shift characteristic. Figure 2 shows the input-output phase difference versus frequency, including the phase inversion introduced by the amplifier (right axis). This response characteristic will be referred to as the inverting, first-order, low-pass response.

Figure 7. Active, single-pole, low-pass filter using an op amp operating in the inverting mode
The circuits shown above attenuate high frequencies and pass low frequencies, and are both low-pass filters. Circuits that pass high frequencies are similar. Figure 8 shows a passive, first-order, high-pass filter circuit configuration, and its phase versus normalized frequency characteristic is shown in Figure 3 (in-phase response). Figure 8.

Passive high-pass filter
The curve in Figure 3 (left axis) is referred to as the in-phase, first-order, high-pass response characteristic. The active circuit of this high-pass filter is shown in Figure 9. Its phase variation with frequency is shown in Figure 3 (right axis). This will be referred to as the inverting, first-order, high-pass response.

Figure 9. Active, single-pole, high-pass filter
[page]
Second-order filter section
There are a variety of circuit structures for second-order filters. The ones discussed here are the Sallen-Key, multiple feedback, state variable structures, and the similar biquad filter structure. They are the most common structures and are relevant to the content of this article. More complete information on the various structures can be found in the references at the end of the article.
Sallen-Key low-pass filter
The widely used Sallen-Key structure, also known as the voltage-controlled voltage source (VCVS) type, was proposed by RP Sallen and EL Key of MIT's Lincoln Laboratory (see Reference 3) in 1955. Figure 10 shows the circuit schematic of a Sallen-Key second-order low-pass filter. One reason for the popularity of this structure is that its performance is basically independent of the performance of the op amp, because the amplifier is mainly used as a buffer. Since the op amp connected as a follower in the basic Sallen-Key circuit is not used to generate voltage gain, its gain-bandwidth requirement is not important. This means that, for a given op amp bandwidth, a higher frequency filter can be designed using this fixed (unity) gain than those circuit configurations where the op amp dynamics are affected by the variable feedback loop characteristics. After passing through the filter, the phase of the signal remains unchanged (non-inverting configuration). Figure 4 shows the phase shift-frequency relationship of a Sallen-Key low-pass filter with Q = 0.707 (or, damping ratio α = 1/Q = 1.414 - Butterworth response). For the sake of simplicity of comparison, this will serve as the performance standard for the second-order filter section considered below.

Figure 10. 2-pole, Sallen-Key low-pass filter
Sallen-Key high-pass filter The
Sallan-Key low-pass circuit can be transformed into a high-pass configuration by interchanging the positions of the capacitors and resistors on the frequency-determining network, as shown in Figure 11, and again using a unity-gain buffer. Its phase shift-frequency relationship is shown in Figure 5 (left axis). This is a non-inverting, second-order, high-pass response.

Figure 11. 2-Pole, Sallen-Key High-Pass Filter
The amplifier gain of the Sallen-Key filter can be increased by connecting a feedback network consisting of a resistive attenuator to the op amp inverting input. However, changing the gain will affect the expressions that determine the frequency network and require recalculating the component values. The dynamic characteristics of this amplifier also need to be more closely examined because they introduce gain into the loop.
Multiple-Feedback (MFB) Low-Pass Filter
The multiple-feedback filter is a single-amplifier circuit structure with an op amp-based integrator (inverting configuration) feedback loop, as shown in Figure 12. Therefore, the op amp parameters have a greater impact on the transfer function than the Sallen-Key implementation. It is difficult to produce a high-Q, high-frequency circuit because the op amp has limited open-loop gain at high frequencies. A guideline is that the op amp's open-loop gain should be at least 20 dB (10 times) higher than the amplitude response at the resonant (or cutoff) frequency, including the peaking caused by the filter's Q. The peak due to Q will have an amplitude of
![]() (5)
(5)
Where: H is the gain of the circuit.

Figure 12. 2-Pole, Multiple Feedback (MFB), Low-Pass Filter
The multiple feedback filter inverts the signal. This is equivalent to adding 180° of phase shift to the filter itself. Figure 4 shows the phase-frequency relationship (right axis). This will be called an inverting, second-order, low-pass response. It is worth noting that the difference between the maximum and minimum component values for a given response is greater in the multiple feedback structure than in the Sallen-Key implementation.
Multiple Feedback (MFB), High-Pass Filter
The above comments about multiple feedback, low-pass filters also apply to the high-pass case. Figure 13 shows a schematic of a multiple feedback, high-pass filter, and its ideal phase shift-filter characteristic is shown in Figure 5 (right axis). This is called an inverting, second-order, high-pass response.

Figure 13. 2-pole, multiple feedback (MFB) high-pass filter
Ensuring high frequency stability of this filter is difficult to achieve because it is based on a differentiator, which, like all differentiators, has a larger closed-loop gain at higher frequencies, thus amplifying noise.
State variable filter
Figure 14 shows a state variable implementation. This structure is the most flexible and accurate implementation at the expense of a much larger number of circuit components, including three op amps. All three major parameters (gain, Q, and ω
0
) can be adjusted independently, and low-pass, high-pass, and bandpass outputs can be provided simultaneously. The gain of the filter is also an independent variable.
Since all parameters of the state variable filter can be adjusted independently, the spread of its component values is very small. Mismatches due to temperature and component tolerances are also minimized. Similar to the multiple feedback circuit above, the gain-bandwidth product of the op amp used in the integrator section becomes a circuit constraint.
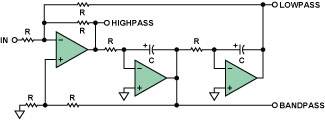
Figure 14. 2-pole, state variable filter
Where the phase shift-frequency characteristic of the lowpass filter section is an inverted second-order response (see Figure 4, right axis), the highpass section circuit will have an inverted highpass response (see Figure 5, right axis).
A close relative of
the biquad
state variable filter is the biquad type (see Figure 15). The name of this circuit was first used by J. Tow in 1968 (see Reference 6) and later by LC Thomas in 1971 (see Reference 5), and its operation is based on the fact that the transfer function is the ratio of two second-order terms. There are slight differences between this circuit and the state variable circuit. In this configuration, no separate highpass output is provided. However, there are two lowpass outputs, one of which is in phase (LOWPASS1) and the other is inverted (LOWPASS2).

Figure 15. Standard biquad 2-pole circuit
With the addition of a fourth amplifier circuit, highpass, notch (lowpass, standard, and highpass), and allpass filters can be realized. Figure 16 shows a schematic of a biquad with a highpass circuit.
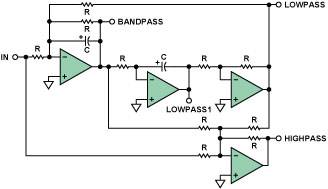
Figure 16. 2-Pole Biquad Filter (with Highpass Section)The phase
shift vs. frequency characteristic of the LOWPASS1 section is an in-phase, second-order, lowpass type response (see Figure 4, left axis). The LOWPASS2 section will have an anti-phase, second-order type response (see Figure 4, right axis). The phase shift characteristic of the HIGHPASS section is an anti-phase characteristic (see Figure 5, right axis).
Conclusion
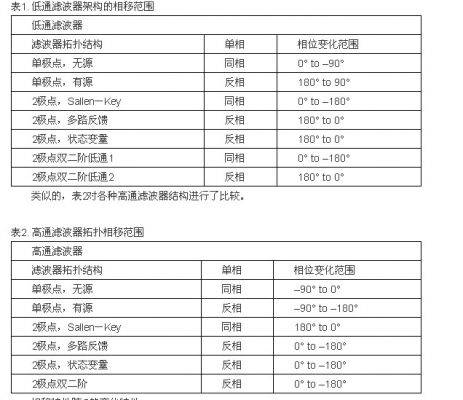
We have seen that the topology used to build a filter will affect its actual phase response. This will be a factor to consider when determining the topology to use. Table 1 compares the phase shift range of the various lowpass filter structures discussed in this article.
Phase shift characteristics with Q
The Q value of the second-order response above is 0.707. Figure 17 shows the effect of Q changes on the phase response of the low-pass filter (and similarly for the high-pass filter). The phase response curves are plotted for Q = 0.1, 0.5, 0.707, 1, 2, 5, 10 and 20. It is worth noting that the phase changes at low Q values begin to change at frequencies far below the cutoff frequency.
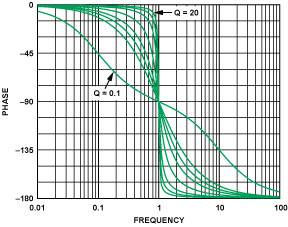
Figure 17. Phase shift characteristics with Q
Although the change in amplitude response with Q value is not the subject of this article, it is also an interesting issue. Figure 18 shows the amplitude response characteristics of a second-order filter when the Q value is changed in the above range.
When high-Q circuits are used in multiple filter stages, the peaking phenomenon of the high-Q circuit response characteristics is also of interest. Although in theory it does not matter in which order these circuit stages are cascaded, in practice it is more advantageous to place the lower Q circuit stage before the high Q circuit stage in order to prevent the peaking phenomenon from exceeding the dynamic range of the filter. Although the plot is for the lowpass section, similar peaking is present in the highpass response.
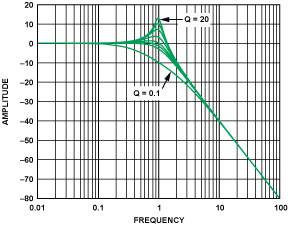
Figure 18. Amplitude peaking of a 2-pole filter as Q changes
Higher-order filters
Transfer functions can be cascaded to create higher-order responses. When the filter responses are connected in series, the dB gain (and attenuation) and phase angle at any frequency are added together. As we pointed out earlier, multi-pole filters are typically built using cascaded second-order sections, with an additional first-order section for odd-order filters. Two cascaded first-order sections do not provide as wide a Q range as a single second-order section.
Figure 19 shows a 4th-order filter constructed by cascading transfer functions. Here, we can see that the filter is constructed from two second-order sections.
![]()
Figure 19. 4-pole filter constructed by cascading transfer functions
Figure 20 shows the effect of three ways of building a 4th-order filter on the phase response. The first structure is built using two Sallen-Key (SK) Butterworth sections. The second is built using two multiple feedback (MFB) Butterworth sections. The third is built using one SK section and one MFB section. However, just as two cascaded first-order sections do not make a second-order section, two cascaded second-order Butterworth sections do not equal a fourth-order Butterworth section. The first Butterworth filter has an f0
of
1 and a Q of 0.5412 (α = 1.8477). The second section has an f0
of
1 and a Q of 1.3065 (α = 0.7654).
As mentioned earlier, the SK section is of the in-phase type, while the MFB is of the anti-phase type. Figure 20 compares the phase shift characteristics of the three fourth-order circuits. The SK and MFB filters have the same phase response because the two anti-phase sections produce an in-phase response (-1 × -1 = +1). The response characteristics of the filter built using the hybrid topology (SK and MFB) will be shifted by 180° (+1 × –1 = –1).

Figure 20. Phase response of 4th order circuits of different configurations
Note that, as might be expected, the overall phase shift characteristic is twice that of a 2nd order section, 360° vs. 180°. A high pass filter will have a similar phase response, but shifted by 180°.
This cascading concept can be used to build higher order filters, but in practice, filters beyond 8th order are difficult to implement. Future articles will examine the phase relationships of bandpass, notch (bandstop), and all pass filters.
Previous article:R&S new version of field strength and power calculation
Next article:Wireless interference issues cannot be ignored
- Apple faces class action lawsuit from 40 million UK iCloud users, faces $27.6 billion in claims
- Apple and Samsung reportedly failed to develop ultra-thin high-density batteries, iPhone 17 Air and Galaxy S25 Slim phones became thicker
- Micron will appear at the 2024 CIIE, continue to deepen its presence in the Chinese market and lead sustainable development
- Qorvo: Innovative technologies lead the next generation of mobile industry
- BOE exclusively supplies Nubia and Red Magic flagship new products with a new generation of under-screen display technology, leading the industry into the era of true full-screen
- OPPO and Hong Kong Polytechnic University renew cooperation to upgrade innovation research center and expand new boundaries of AI imaging
- Gurman: Vision Pro will upgrade the chip, Apple is also considering launching glasses connected to the iPhone
- OnePlus 13 officially released: the first flagship of the new decade is "Super Pro in every aspect"
- Goodix Technology helps iQOO 13 create a new flagship experience for e-sports performance
- Innolux's intelligent steer-by-wire solution makes cars smarter and safer
- 8051 MCU - Parity Check
- How to efficiently balance the sensitivity of tactile sensing interfaces
- What should I do if the servo motor shakes? What causes the servo motor to shake quickly?
- 【Brushless Motor】Analysis of three-phase BLDC motor and sharing of two popular development boards
- Midea Industrial Technology's subsidiaries Clou Electronics and Hekang New Energy jointly appeared at the Munich Battery Energy Storage Exhibition and Solar Energy Exhibition
- Guoxin Sichen | Application of ferroelectric memory PB85RS2MC in power battery management, with a capacity of 2M
- Analysis of common faults of frequency converter
- In a head-on competition with Qualcomm, what kind of cockpit products has Intel come up with?
- Dalian Rongke's all-vanadium liquid flow battery energy storage equipment industrialization project has entered the sprint stage before production
- Allegro MicroSystems Introduces Advanced Magnetic and Inductive Position Sensing Solutions at Electronica 2024
- Car key in the left hand, liveness detection radar in the right hand, UWB is imperative for cars!
- After a decade of rapid development, domestic CIS has entered the market
- Aegis Dagger Battery + Thor EM-i Super Hybrid, Geely New Energy has thrown out two "king bombs"
- A brief discussion on functional safety - fault, error, and failure
- In the smart car 2.0 cycle, these core industry chains are facing major opportunities!
- The United States and Japan are developing new batteries. CATL faces challenges? How should China's new energy battery industry respond?
- Murata launches high-precision 6-axis inertial sensor for automobiles
- Ford patents pre-charge alarm to help save costs and respond to emergencies
- New real-time microcontroller system from Texas Instruments enables smarter processing in automotive and industrial applications
- [Synopsys IP Resources] Using 1.6T Ethernet to meet growing bandwidth demands
- Design of Internet Radio Based on RSIC-V RVB2601 (4)
- MicroPython Firmware Development Tutorial
- One article to understand the RF chip industry chain and its domestic status!
- Super detailed teaching you how to use HFSS to design and simulate inverted F antenna 1
- How to implement the function?
- Configuration and use of TMS320F28379D SCID SCIB
- 40 Practical Knowledge Summary of Analog Circuits
- Research on the application of white light LED driving based on electric field induced power amplifier
- About DSP clock and PLL issues

 Introduction to Artificial Intelligence and Robotics (Murphy)
 Detailed circuit introduction of commonly used operational amplifiers.doc


 京公网安备 11010802033920号