In the design of photoelectric integral color measurement system, silicon photocells are usually selected as photodetectors. Silicon photocells can directly convert light information (energy) into electrical information (energy), which is convenient for processing the measured signal. Since the temperature of the lamp wall of the standard light source is high, it has a great influence on the temperature inside the detector. Silicon photocells are affected by temperature and produce voltage drift, which will inevitably affect the measurement accuracy and stability. By studying the law of the change of the photoelectric conversion characteristics of silicon photocells with temperature, a V-T curve control compensation method using the digital temperature sensor DSl8820 is designed to perform appropriate voltage compensation on the color measurement system to achieve better performance indicators.
1 Characteristics of silicon photocells
In the color measurement system, the optical signal of the sample to be measured is converted into an electrical signal through the photodetector. The collected output electrical signal is extremely weak and needs to be converted and amplified. There are two main reasons for temperature drift in these links:
(1) The temperature characteristics of silicon photocells have a great influence on the output voltage;
(2) In the amplifier circuit, any parameter change, such as power supply voltage fluctuation, component aging, and changes in semiconductor component parameters with temperature, will cause output voltage drift. The
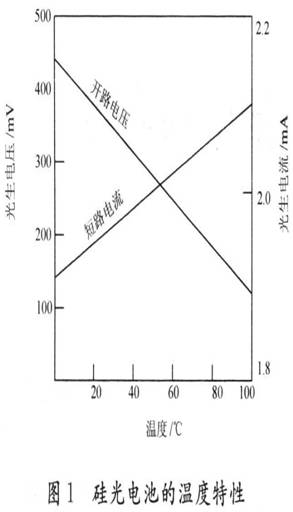
temperature characteristics of silicon photocells refer to the changes in open circuit voltage and short circuit current with temperature. Since it is related to the temperature drift of the instrument and equipment using the photocell, affecting important indicators such as measurement accuracy or control accuracy, the temperature characteristic is one of the important characteristics of silicon photocells. As can be seen from Figure 1, the open circuit voltage of silicon photocells decreases significantly with the increase of temperature, while the short circuit current increases slowly with the increase of temperature. Therefore, when using silicon photocells as detection elements, the influence of temperature drift should be considered and corresponding compensation measures should be adopted.
2 DS18820 real-time temperature acquisition
DS18820 is a single-wire intelligent digital temperature sensor produced by DALLAS, with a 3-pin TO-92 small package, where: DQ is the digital signal input/output terminal; GND is the power ground; VDD is the external power supply input terminal (grounded in parasitic power wiring mode). The internal structure of DS18820 mainly consists of 4 parts: 64-bit ROM, temperature sensor, non-volatile temperature alarm triggers TH and TL, and configuration registers.
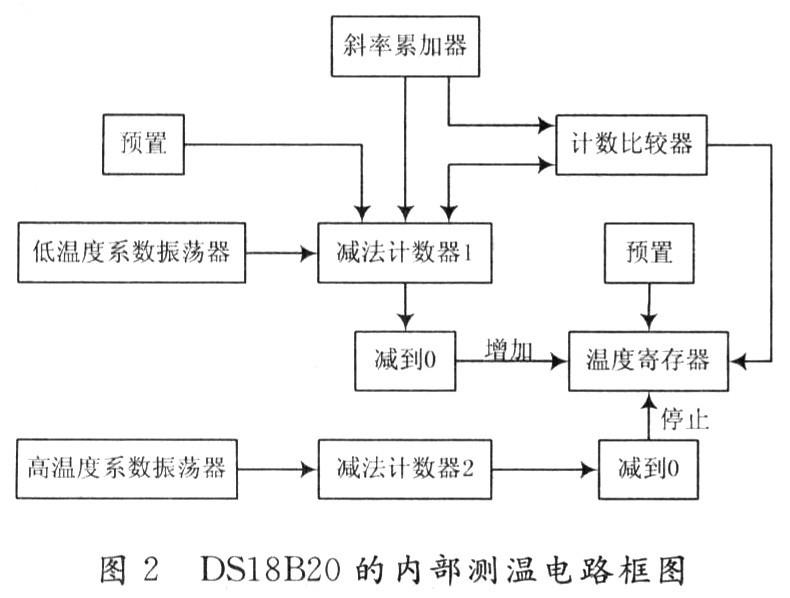
The temperature measurement principle of DS18820 is shown in Figure 2: Before each measurement, the base corresponding to -55°C is first placed in the subtraction counter 1 and the temperature register respectively. Subtraction counter 1 counts the pulse signal generated by the low temperature coefficient crystal oscillator. When the preset value of subtraction counter 1 is reduced to 0, the value of the temperature register will be increased by 1, the preset of subtraction counter 1 will be reloaded, and subtraction counter 1 will start counting the pulse signal generated by the low temperature coefficient crystal oscillator again. This cycle will continue until subtraction counter 2 counts to 0, and then the accumulation of the temperature register value will be stopped. At this time, the value in the temperature register is the measured temperature. The slope accumulator is used to compensate and correct the nonlinearity in the temperature measurement process, and its output is used to correct the preset value of the subtraction counter. As long as the counting gate is not closed, the above process will be repeated until the temperature register value reaches the measured temperature value.
3 Design of V-T curve controlled temperature compensation
The heat generated by the light source and the mechanical structure of the detector make the internal temperature of the photodetector increase with the increase of measurement time, and the voltage value of the three analog signals collected by the silicon photocell gradually decreases. In view of this phenomenon, the voltage value of the three signals is usually compensated in time periods. Experiments show that the relationship between time and voltage value cannot be used as the basis for accurately controlling the voltage value compensation of the three analog signals: on the one hand, the voltage value of the three analog signals collected according to time changes is not completely linear; on the other hand, the temperature characteristics of the silicon photocell are the main reason for temperature drift. [page]
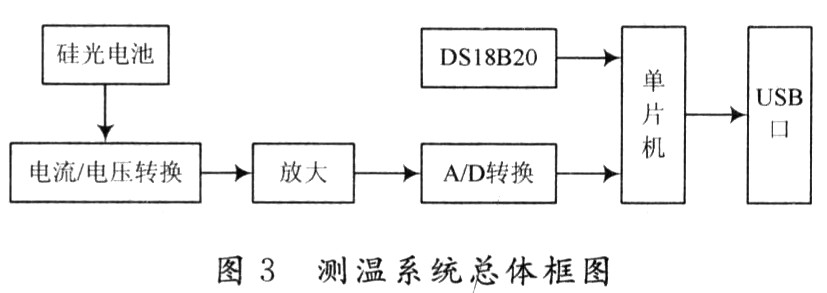
Here, the temperature sensor DSl8820 is used to obtain the real-time temperature, and the temperature compensation coefficient is obtained by combining the voltage value analysis to perform voltage compensation, so as to realize the voltage-temperature curve (V-T curve) control compensation. According to the temperature measurement principle of the temperature sensor, a method for realizing V-T curve compensation is designed, and the overall block diagram of the system is shown in Figure 3. According to formula (1), combined with the actual measurement data analysis, the appropriate temperature compensation coefficient K is obtained, so that when the temperature rises, the measured voltage is properly compensated, so that the measured voltage value after compensation has good stability.
Wherein, V0 is the initial value of voltage; V is the measured value of voltage; T is the measured temperature; T0 is the initial value of temperature; K is the temperature compensation coefficient.
3.1 Selection of temperature compensation coefficient
The core of V-T curve control temperature compensation lies in the selection of temperature compensation coefficient K, which is obtained according to formula (1):

In the color measurement system, the voltage and temperature values obtained when measuring the standard white plate for the first time after zeroing are used as the initial values of the voltage and temperature in formula (2). By continuously measuring the standard white plate, the voltage values of the three analog signals at different temperatures can be obtained. As the temperature rises, the voltage drift generated by the silicon photocell will be reflected in these voltage values. The slope of the curve of the linear change of the voltage value with the temperature is calculated in combination with the measured data, and the obtained slope of the curve is the temperature compensation coefficient K. The temperature compensation coefficient K is introduced into the voltage compensation. For each voltage value obtained by measurement, the voltage measurement value can be compensated in combination with the measured temperature to obtain the actual voltage value. As shown in formula (3):

In the formula, Vt is the actual voltage value; V is the voltage measurement value; T is the temperature measurement value; T0 is the initial temperature value; K is the temperature compensation coefficient.
3.2 Hardware Implementation
The WSC-Y colorimeter uses the STC89C58RD+ new generation super anti-interference/high speed/low power consumption single-chip microcomputer as the main processor to complete the main measurement and control tasks. The DS18820 connected to the single-chip microcomputer single bus uses an external VDD power supply (without parasitic power supply), the CPU in the system uses a 22 MHz crystal oscillator, and the DQ terminal is P1.1. The hardware circuit of the main part of the system is shown in Figure 4.
3.3 Software Implementation
The simple hardware interface of DS18820 comes at the cost of relatively complex interface programming. Since DS18820 communicates with the single-chip microcomputer through a single bus, the interface protocol between DS18820 and the single-chip microcomputer is implemented through strict timing. The single-chip microcomputer controls DS18820 to complete temperature conversion through three steps: initialization, ROM operation instructions, and memory operation instructions. You must first start the DS18820 to start the conversion, and then read the temperature conversion value. In addition, in actual applications, it should be noted that it takes a certain conversion time from the end of temperature measurement to the conversion of the temperature value into a digital value. Therefore, it is necessary to delay 1 second after the temperature reading before processing the data. This must be guaranteed, otherwise it will cause conversion errors and output wrong temperature values. The temperature sensor control program is written based on the DS18820 communication protocol. The program flow chart for the operation of DS18820 is shown in Figure 5.

3.3.1 Initialization subroutine
The temperature measurement system uses P1.1 as the communication port. During the initialization of DS18820, the microcontroller first sends a reset pulse, which is kept at a low level for more than 480μs. Then the microcontroller releases the bus and waits for the response pulse of DS18820. If the P1.1 port receives 0, the initialization is successful, and if it receives 1, the initialization fails. In this way, the microcontroller and the temperature sensor have completed one initialization communication. [page]
3.3.2 Reading temperature data
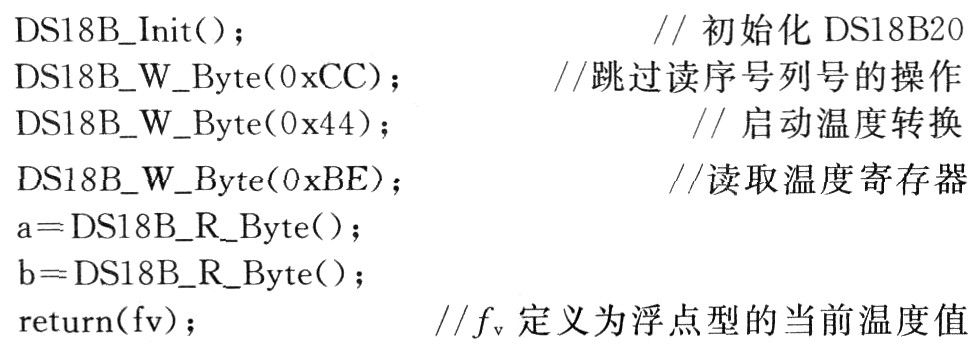
Using the default 12-bit conversion accuracy and an external power supply, the program to complete a conversion and read the temperature value is as follows:
3.3.3 V-T curve control compensation subroutine
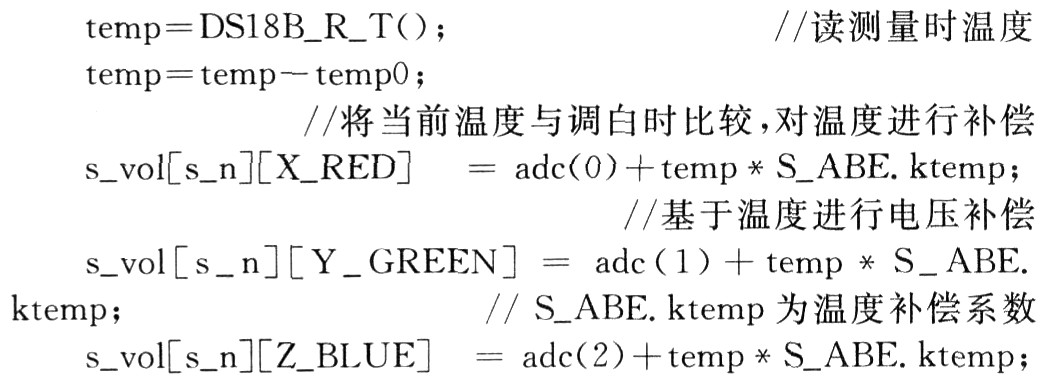
The implementation of the temperature compensation function is as follows:
4 Experimental results analysis and conclusion
After applying the design of the V-T curve control compensation circuit to the color measurement system, the colorimeter was preheated for 30 minutes to stabilize the light source, and the instrument was calibrated. The dedicated working white board was measured once every 5 minutes. During the measurement, the white board remained motionless and the measurement results were good. Tables 1 and 2 are the measurement results of the same standard white board for half an hour before and after temperature compensation of the system.
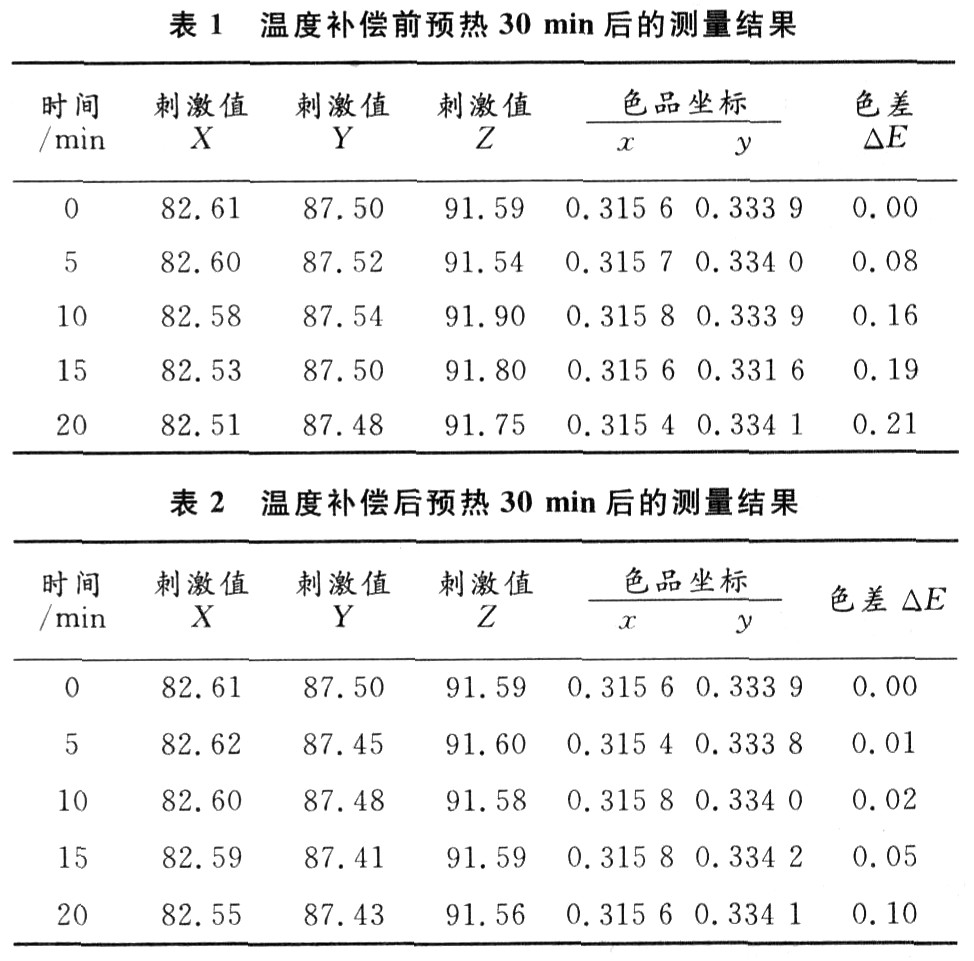
It can be seen from the measurement data that after the system is temperature compensated, the measurement accuracy of the color measurement system is greatly improved and the error is significantly reduced. After the temperature sensor is introduced, the color difference △E of the color measurement system is less than 0.15, and the repeatability of the measurement fully meets the requirement of △E<0.2 within 15 minutes stipulated by the National Institute of Metrology. According to the actual requirements of the color measurement system, flexible temperature compensation technology and feasible voltage compensation method are adopted to effectively complete the stability control of the color measurement system. The experimental results show that after using the digital temperature sensor to compensate the measured voltage of the color measurement system, the measurement error is reduced and the stability and accuracy of the instrument are improved.
Reference address:Application of digital temperature sensor in color measurement system
1 Characteristics of silicon photocells
In the color measurement system, the optical signal of the sample to be measured is converted into an electrical signal through the photodetector. The collected output electrical signal is extremely weak and needs to be converted and amplified. There are two main reasons for temperature drift in these links:
(1) The temperature characteristics of silicon photocells have a great influence on the output voltage;
(2) In the amplifier circuit, any parameter change, such as power supply voltage fluctuation, component aging, and changes in semiconductor component parameters with temperature, will cause output voltage drift. The
temperature characteristics of silicon photocells refer to the changes in open circuit voltage and short circuit current with temperature. Since it is related to the temperature drift of the instrument and equipment using the photocell, affecting important indicators such as measurement accuracy or control accuracy, the temperature characteristic is one of the important characteristics of silicon photocells. As can be seen from Figure 1, the open circuit voltage of silicon photocells decreases significantly with the increase of temperature, while the short circuit current increases slowly with the increase of temperature. Therefore, when using silicon photocells as detection elements, the influence of temperature drift should be considered and corresponding compensation measures should be adopted.

2 DS18820 real-time temperature acquisition
DS18820 is a single-wire intelligent digital temperature sensor produced by DALLAS, with a 3-pin TO-92 small package, where: DQ is the digital signal input/output terminal; GND is the power ground; VDD is the external power supply input terminal (grounded in parasitic power wiring mode). The internal structure of DS18820 mainly consists of 4 parts: 64-bit ROM, temperature sensor, non-volatile temperature alarm triggers TH and TL, and configuration registers.
The temperature measurement principle of DS18820 is shown in Figure 2: Before each measurement, the base corresponding to -55°C is first placed in the subtraction counter 1 and the temperature register respectively. Subtraction counter 1 counts the pulse signal generated by the low temperature coefficient crystal oscillator. When the preset value of subtraction counter 1 is reduced to 0, the value of the temperature register will be increased by 1, the preset of subtraction counter 1 will be reloaded, and subtraction counter 1 will start counting the pulse signal generated by the low temperature coefficient crystal oscillator again. This cycle will continue until subtraction counter 2 counts to 0, and then the accumulation of the temperature register value will be stopped. At this time, the value in the temperature register is the measured temperature. The slope accumulator is used to compensate and correct the nonlinearity in the temperature measurement process, and its output is used to correct the preset value of the subtraction counter. As long as the counting gate is not closed, the above process will be repeated until the temperature register value reaches the measured temperature value.

3 Design of V-T curve controlled temperature compensation
The heat generated by the light source and the mechanical structure of the detector make the internal temperature of the photodetector increase with the increase of measurement time, and the voltage value of the three analog signals collected by the silicon photocell gradually decreases. In view of this phenomenon, the voltage value of the three signals is usually compensated in time periods. Experiments show that the relationship between time and voltage value cannot be used as the basis for accurately controlling the voltage value compensation of the three analog signals: on the one hand, the voltage value of the three analog signals collected according to time changes is not completely linear; on the other hand, the temperature characteristics of the silicon photocell are the main reason for temperature drift. [page]
Here, the temperature sensor DSl8820 is used to obtain the real-time temperature, and the temperature compensation coefficient is obtained by combining the voltage value analysis to perform voltage compensation, so as to realize the voltage-temperature curve (V-T curve) control compensation. According to the temperature measurement principle of the temperature sensor, a method for realizing V-T curve compensation is designed, and the overall block diagram of the system is shown in Figure 3. According to formula (1), combined with the actual measurement data analysis, the appropriate temperature compensation coefficient K is obtained, so that when the temperature rises, the measured voltage is properly compensated, so that the measured voltage value after compensation has good stability.
Wherein, V0 is the initial value of voltage; V is the measured value of voltage; T is the measured temperature; T0 is the initial value of temperature; K is the temperature compensation coefficient.

3.1 Selection of temperature compensation coefficient
The core of V-T curve control temperature compensation lies in the selection of temperature compensation coefficient K, which is obtained according to formula (1):

In the color measurement system, the voltage and temperature values obtained when measuring the standard white plate for the first time after zeroing are used as the initial values of the voltage and temperature in formula (2). By continuously measuring the standard white plate, the voltage values of the three analog signals at different temperatures can be obtained. As the temperature rises, the voltage drift generated by the silicon photocell will be reflected in these voltage values. The slope of the curve of the linear change of the voltage value with the temperature is calculated in combination with the measured data, and the obtained slope of the curve is the temperature compensation coefficient K. The temperature compensation coefficient K is introduced into the voltage compensation. For each voltage value obtained by measurement, the voltage measurement value can be compensated in combination with the measured temperature to obtain the actual voltage value. As shown in formula (3):

In the formula, Vt is the actual voltage value; V is the voltage measurement value; T is the temperature measurement value; T0 is the initial temperature value; K is the temperature compensation coefficient.
3.2 Hardware Implementation
The WSC-Y colorimeter uses the STC89C58RD+ new generation super anti-interference/high speed/low power consumption single-chip microcomputer as the main processor to complete the main measurement and control tasks. The DS18820 connected to the single-chip microcomputer single bus uses an external VDD power supply (without parasitic power supply), the CPU in the system uses a 22 MHz crystal oscillator, and the DQ terminal is P1.1. The hardware circuit of the main part of the system is shown in Figure 4.
3.3 Software Implementation
The simple hardware interface of DS18820 comes at the cost of relatively complex interface programming. Since DS18820 communicates with the single-chip microcomputer through a single bus, the interface protocol between DS18820 and the single-chip microcomputer is implemented through strict timing. The single-chip microcomputer controls DS18820 to complete temperature conversion through three steps: initialization, ROM operation instructions, and memory operation instructions. You must first start the DS18820 to start the conversion, and then read the temperature conversion value. In addition, in actual applications, it should be noted that it takes a certain conversion time from the end of temperature measurement to the conversion of the temperature value into a digital value. Therefore, it is necessary to delay 1 second after the temperature reading before processing the data. This must be guaranteed, otherwise it will cause conversion errors and output wrong temperature values. The temperature sensor control program is written based on the DS18820 communication protocol. The program flow chart for the operation of DS18820 is shown in Figure 5.

3.3.1 Initialization subroutine
The temperature measurement system uses P1.1 as the communication port. During the initialization of DS18820, the microcontroller first sends a reset pulse, which is kept at a low level for more than 480μs. Then the microcontroller releases the bus and waits for the response pulse of DS18820. If the P1.1 port receives 0, the initialization is successful, and if it receives 1, the initialization fails. In this way, the microcontroller and the temperature sensor have completed one initialization communication. [page]
3.3.2 Reading temperature data
Using the default 12-bit conversion accuracy and an external power supply, the program to complete a conversion and read the temperature value is as follows:

3.3.3 V-T curve control compensation subroutine
The implementation of the temperature compensation function is as follows:

4 Experimental results analysis and conclusion
After applying the design of the V-T curve control compensation circuit to the color measurement system, the colorimeter was preheated for 30 minutes to stabilize the light source, and the instrument was calibrated. The dedicated working white board was measured once every 5 minutes. During the measurement, the white board remained motionless and the measurement results were good. Tables 1 and 2 are the measurement results of the same standard white board for half an hour before and after temperature compensation of the system.

It can be seen from the measurement data that after the system is temperature compensated, the measurement accuracy of the color measurement system is greatly improved and the error is significantly reduced. After the temperature sensor is introduced, the color difference △E of the color measurement system is less than 0.15, and the repeatability of the measurement fully meets the requirement of △E<0.2 within 15 minutes stipulated by the National Institute of Metrology. According to the actual requirements of the color measurement system, flexible temperature compensation technology and feasible voltage compensation method are adopted to effectively complete the stability control of the color measurement system. The experimental results show that after using the digital temperature sensor to compensate the measured voltage of the color measurement system, the measurement error is reduced and the stability and accuracy of the instrument are improved.
Previous article:Design of digital voice thermometer
Next article:Single bus multi-point temperature measurement technology based on DS1820
- Popular Resources
- Popular amplifiers
Recommended Content
Latest Microcontroller Articles
- Learn ARM development(16)
- Learn ARM development(17)
- Learn ARM development(18)
- Embedded system debugging simulation tool
- A small question that has been bothering me recently has finally been solved~~
- Learn ARM development (1)
- Learn ARM development (2)
- Learn ARM development (4)
- Learn ARM development (6)
He Limin Column
Microcontroller and Embedded Systems Bible
 Professor at Beihang University, dedicated to promoting microcontrollers and embedded systems for over 20 years.
MoreSelected Circuit Diagrams
MorePopular Articles
- LED chemical incompatibility test to see which chemicals LEDs can be used with
- Application of ARM9 hardware coprocessor on WinCE embedded motherboard
- What are the key points for selecting rotor flowmeter?
- LM317 high power charger circuit
- A brief analysis of Embest's application and development of embedded medical devices
- Single-phase RC protection circuit
- stm32 PVD programmable voltage monitor
- Introduction and measurement of edge trigger and level trigger of 51 single chip microcomputer
- Improved design of Linux system software shell protection technology
- What to do if the ABB robot protection device stops
MoreDaily News
- Analysis of the application of several common contact parts in high-voltage connectors of new energy vehicles
- Wiring harness durability test and contact voltage drop test method
- From probes to power supplies, Tektronix is leading the way in comprehensive innovation in power electronics testing
- From probes to power supplies, Tektronix is leading the way in comprehensive innovation in power electronics testing
- Sn-doped CuO nanostructure-based ethanol gas sensor for real-time drunk driving detection in vehicles
- Design considerations for automotive battery wiring harness
- Do you know all the various motors commonly used in automotive electronics?
- What are the functions of the Internet of Vehicles? What are the uses and benefits of the Internet of Vehicles?
- Power Inverter - A critical safety system for electric vehicles
- Analysis of the information security mechanism of AUTOSAR, the automotive embedded software framework
Guess you like
- "Recommend Chinese Chip" + Qinheng CH549
- Today is Double 11, have you grabbed the goods? Don’t forget to participate in our product sharing event!
- How to solve the design problem of irregular PCB?
- I am poor and I want to earn some download points
- EEWORLD University Hall----Live Replay: Develop AI Intelligent Robots Based on TI's Newly Released Robotics SDK
- The 2022 provincial competition questions are out
- Wireless data transmission network for pipeline monitoring based on ZigBee technology
- [NXP Rapid IoT Review] In the second week, I can finally open Rapid IoT Studio!
- Multicast Network Design Based on C6000 DSP NDK
- Help: Cost-saving replacement for two touch switches

 LM193H/883B


 京公网安备 11010802033920号