If you need to design an active filter, you can face a huge challenge, especially when doing the filter calculations manually. There are so many variables to consider.
Looking at Figure 1, you need to address these issues and more. This may seem incredible and even a bit self-inflicted, but the fact is that I have done these types of calculations and each filter can easily consume hours of my time.
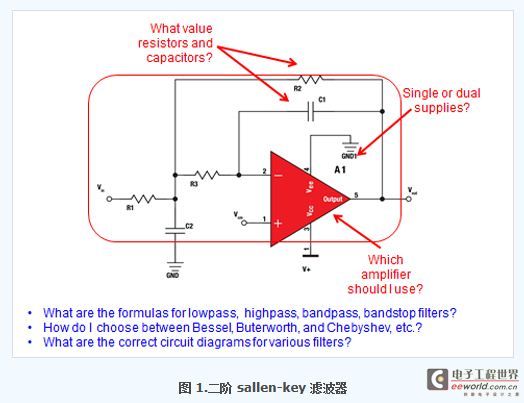
A better approach is to use one of the many software programs available on the website. This is indeed a more efficient approach, but before you start, you need to think about what you want to do with the filter program.
My opinion is to determine what a tool should include based on personal experience and understanding of customer needs. We used this information to define the scope of TI's new WEBENCH Filter Design Tool, one of the most robust filter design tools available.
Here are some of the important requirements we identified:
● Low-pass, high-pass, band-pass and band-stop (notch) filters are a minimum.
● Control of frequency response and number of poles.
● Various types of approximation filters, such as Bessel, Butterworth, Chebyshev, linear phase and/or Transitional Gaussian filters.
● Graphical comparison of different approximation types.
● Complete circuit diagrams with actual recommended resistor and capacitor values.
● Various circuit topologies, such as Sallen-Key and multiple feedback designs.
● Appropriate actual components identified for the design options.
● SPICE simulation models of the final filter circuits.
So let’s look at how the WEBENCH Filter Designer tool meets these requirements.
This is your landing view of the tool.
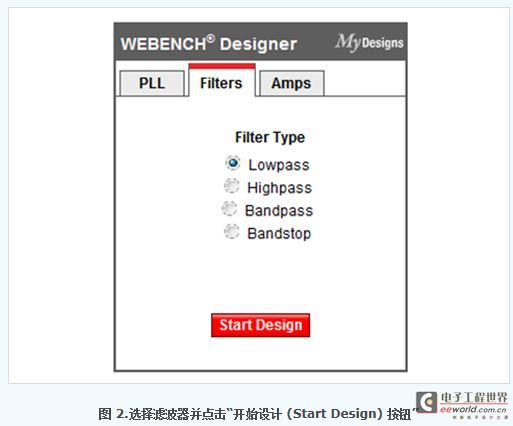
You will see a Getting Started guide on the left side of the page. If you want to start the tool directly, go ahead and select the filter type (lowpass, highpass, bandpass, or bandstop) and click “Start Design.”
Filter Designer Requirements Page
The software will take you to the “Filter Designer Requirements” page of the WEBENCH Filter Designer program. Here you can select the specific filter characteristics (Figure 3).
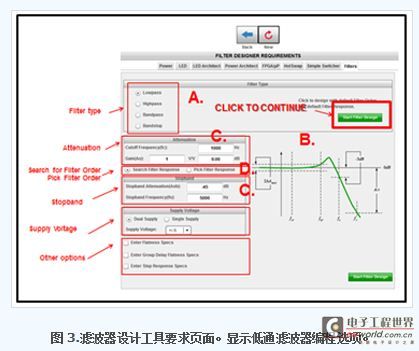
If needed, you can change the filter type (lowpass, highpass, bandpass, or bandstop {3.A}) on this page.
Note the graphical representation of the filter amplitude versus frequency on the right side of the screen (3.B). Looking at the lower left side of this view, the Attenuation section allows you to program the corner frequency and the rate of attenuation after the corner frequency of the bandstop section (3.C). [page]
Alternatively, you can select the filter order by selecting the Select Filter Response button (3.D).
Once all entries are filled in, you can click the Start Filter Design button.
Filter Design Tool Viewer Page
After making these selections, the tool will move to the Filter Design Tool Viewer page (Figure 4). This page contains six panels: Optimizer, Change Inputs, Adjust Results, Advanced Graphing, and Solutions & Graphs. All of these panels offer useful options, but we will focus on the three sections highlighted in Figure 4.
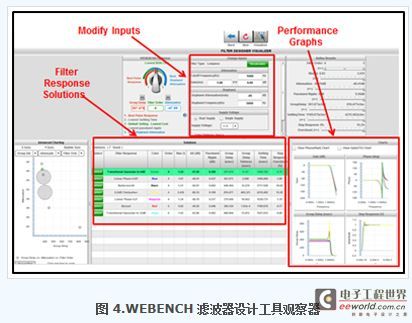
In the Filter Response Solutions section, you will see several approximation filter types (Butterworth, Bessel, Chebyshev, etc.).
As you begin to select approximation types, you may be interested in the Performance Graphs section. This area allows you to compare the filters in the Filter Response Solutions section in terms of gain, phase, group delay, and settling time. In addition, you can rewrite the entries in the Modify Inputs panel.
Once you are ready, click the Select button in the Solutions panel to select the approximation type.
Filter Design Tool Design Summary Page
Now it is time to get into the details of the filter. In the program's Design Summary page, you will immediately see the completed filter circuit (Figure 5.A).
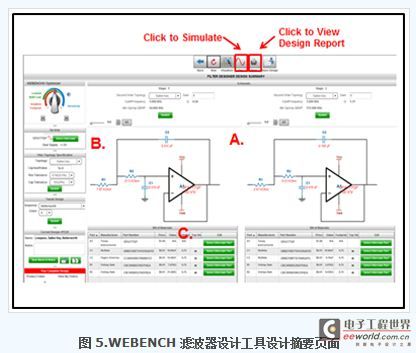
From here, you can keep the Sallen-Key circuit topology or change it to a multiple feedback topology in the Filter Topology Selection area (5.B). You can also select the exact parameters for the resistors and/or capacitors in this area. Click the Update button to save your changes. Is
this the time to call it a day? If you choose to call it a day, you are good to go. You will see the complete Bill of Materials (BOM) (5.C) at the bottom of this view. The BOM includes all the components in your circuit along with the manufacturer, part number, price, and available replacement parts. If you choose, you can change any or all of the components in the circuit.
If you would like to see the simulation results of the filter, simply click on the Simulate icon ( ) at the top of the page.
Filter Design Tool Simulation Page
After clicking on the icon, the Filter Design Tool Design Summary page appears. There are three simulation algorithms to choose from, however, the closed-loop frequency plots appear immediately (Figure 6). The
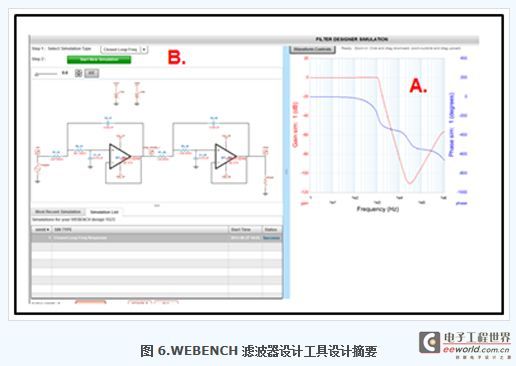
closed-loop filter magnitude and phase plots appear for a frequency range of 30 frequencies above and below the corner frequency (for a low-pass filter ). The other two simulation algorithms provide a filter with a sine wave input signal and a pulse signal. In all three use cases, you can modify the input signal frequency, amplitude, and other timing issues.
Keywords:TI WEBENCH
Reference address:Trying to design an active filter?
Looking at Figure 1, you need to address these issues and more. This may seem incredible and even a bit self-inflicted, but the fact is that I have done these types of calculations and each filter can easily consume hours of my time.

A better approach is to use one of the many software programs available on the website. This is indeed a more efficient approach, but before you start, you need to think about what you want to do with the filter program.
My opinion is to determine what a tool should include based on personal experience and understanding of customer needs. We used this information to define the scope of TI's new WEBENCH Filter Design Tool, one of the most robust filter design tools available.
Here are some of the important requirements we identified:
● Low-pass, high-pass, band-pass and band-stop (notch) filters are a minimum.
● Control of frequency response and number of poles.
● Various types of approximation filters, such as Bessel, Butterworth, Chebyshev, linear phase and/or Transitional Gaussian filters.
● Graphical comparison of different approximation types.
● Complete circuit diagrams with actual recommended resistor and capacitor values.
● Various circuit topologies, such as Sallen-Key and multiple feedback designs.
● Appropriate actual components identified for the design options.
● SPICE simulation models of the final filter circuits.
So let’s look at how the WEBENCH Filter Designer tool meets these requirements.
This is your landing view of the tool.

You will see a Getting Started guide on the left side of the page. If you want to start the tool directly, go ahead and select the filter type (lowpass, highpass, bandpass, or bandstop) and click “Start Design.”
Filter Designer Requirements Page
The software will take you to the “Filter Designer Requirements” page of the WEBENCH Filter Designer program. Here you can select the specific filter characteristics (Figure 3).

If needed, you can change the filter type (lowpass, highpass, bandpass, or bandstop {3.A}) on this page.
Note the graphical representation of the filter amplitude versus frequency on the right side of the screen (3.B). Looking at the lower left side of this view, the Attenuation section allows you to program the corner frequency and the rate of attenuation after the corner frequency of the bandstop section (3.C). [page]
Alternatively, you can select the filter order by selecting the Select Filter Response button (3.D).
Once all entries are filled in, you can click the Start Filter Design button.
Filter Design Tool Viewer Page
After making these selections, the tool will move to the Filter Design Tool Viewer page (Figure 4). This page contains six panels: Optimizer, Change Inputs, Adjust Results, Advanced Graphing, and Solutions & Graphs. All of these panels offer useful options, but we will focus on the three sections highlighted in Figure 4.

In the Filter Response Solutions section, you will see several approximation filter types (Butterworth, Bessel, Chebyshev, etc.).
As you begin to select approximation types, you may be interested in the Performance Graphs section. This area allows you to compare the filters in the Filter Response Solutions section in terms of gain, phase, group delay, and settling time. In addition, you can rewrite the entries in the Modify Inputs panel.
Once you are ready, click the Select button in the Solutions panel to select the approximation type.
Filter Design Tool Design Summary Page
Now it is time to get into the details of the filter. In the program's Design Summary page, you will immediately see the completed filter circuit (Figure 5.A).

From here, you can keep the Sallen-Key circuit topology or change it to a multiple feedback topology in the Filter Topology Selection area (5.B). You can also select the exact parameters for the resistors and/or capacitors in this area. Click the Update button to save your changes. Is
this the time to call it a day? If you choose to call it a day, you are good to go. You will see the complete Bill of Materials (BOM) (5.C) at the bottom of this view. The BOM includes all the components in your circuit along with the manufacturer, part number, price, and available replacement parts. If you choose, you can change any or all of the components in the circuit.
If you would like to see the simulation results of the filter, simply click on the Simulate icon ( ) at the top of the page.
Filter Design Tool Simulation Page
After clicking on the icon, the Filter Design Tool Design Summary page appears. There are three simulation algorithms to choose from, however, the closed-loop frequency plots appear immediately (Figure 6). The

closed-loop filter magnitude and phase plots appear for a frequency range of 30 frequencies above and below the corner frequency (for a low-pass filter ). The other two simulation algorithms provide a filter with a sine wave input signal and a pulse signal. In all three use cases, you can modify the input signal frequency, amplitude, and other timing issues.
Previous article:Becoming a DSO Expert: Ten More Tips to Expand Your Oscilloscope's Uses
Next article:Harmonic test analysis and control solutions for harmonic source equipment in colleges and universities
- Popular Resources
- Popular amplifiers
Recommended Content
Latest Test Measurement Articles
- Seizing the Opportunities in the Chinese Application Market: NI's Challenges and Answers
- Tektronix Launches Breakthrough Power Measurement Tools to Accelerate Innovation as Global Electrification Accelerates
- Not all oscilloscopes are created equal: Why ADCs and low noise floor matter
- Enable TekHSI high-speed interface function to accelerate the remote transmission of waveform data
- How to measure the quality of soft start thyristor
- How to use a multimeter to judge whether a soft starter is good or bad
- What are the advantages and disadvantages of non-contact temperature sensors?
- In what situations are non-contact temperature sensors widely used?
- How non-contact temperature sensors measure internal temperature
MoreSelected Circuit Diagrams
MorePopular Articles
- LED chemical incompatibility test to see which chemicals LEDs can be used with
- Application of ARM9 hardware coprocessor on WinCE embedded motherboard
- What are the key points for selecting rotor flowmeter?
- LM317 high power charger circuit
- A brief analysis of Embest's application and development of embedded medical devices
- Single-phase RC protection circuit
- stm32 PVD programmable voltage monitor
- Introduction and measurement of edge trigger and level trigger of 51 single chip microcomputer
- Improved design of Linux system software shell protection technology
- What to do if the ABB robot protection device stops
MoreDaily News
- CGD and Qorvo to jointly revolutionize motor control solutions
- CGD and Qorvo to jointly revolutionize motor control solutions
- Keysight Technologies FieldFox handheld analyzer with VDI spread spectrum module to achieve millimeter wave analysis function
- Infineon's PASCO2V15 XENSIV PAS CO2 5V Sensor Now Available at Mouser for Accurate CO2 Level Measurement
- Advanced gameplay, Harting takes your PCB board connection to a new level!
- Advanced gameplay, Harting takes your PCB board connection to a new level!
- A new chapter in Great Wall Motors R&D: solid-state battery technology leads the future
- Naxin Micro provides full-scenario GaN driver IC solutions
- Interpreting Huawei’s new solid-state battery patent, will it challenge CATL in 2030?
- Are pure electric/plug-in hybrid vehicles going crazy? A Chinese company has launched the world's first -40℃ dischargeable hybrid battery that is not afraid of cold
Guess you like
- Principles of Radar (5th Edition)
- Current Sensing Using Nanopower Op Amps
- Looking for a microcontroller model
- Analysis of the problem that the program cannot run after F28004x online debugging reset
- Is the STM32 library function HAL_UART_Receive blocking?
- 【DIY Creative LED V2】Complete program
- The Engineer's Way of Quanhui, the author of "FPGA Timing Constraints and Analysis"
- ALTERA cyclone V sockit development board for sale at low price and can be exchanged for E coins
- GD32L233C-START Review——04. Comparison between analog IIC and hardware IIC driving OLED
- What is the driving voltage in LCD segment code screen?

 LM310J


 京公网安备 11010802033920号