The average power measurement of WiMAX or WLAN burst signals is an essential parameter for characterizing wireless communication devices such as chipsets, PC cards, amplifier modules or mobile phones. Device manufacturers are increasingly having difficulty selecting the right power measurement tools. They need fast and accurate power measurements of broadband WiMAX and WLAN signals, and the ability to measure only the transmitted bursts.
Normally, only peak power meters can perform burst average power measurements (also called "time-gated average power measurement" or simply "burst power"), which quickly samples the signal to capture its power envelope. The user can set two cursors around the burst signal to define a "gate" to measure the average power or peak power of the burst signal. This is the most common method for accurately measuring the peak power and average power of any burst signal.
With the advent of USB power sensors that use advanced digitizing techniques and ultra-fast electronics, users can now make accurate burst average power measurements faster and at a lower cost without sacrificing measurement accuracy. Using the time gating function, you can define the start and length of the gating (referenced to the trigger input signal) to select the relevant portion of the burst signal to be measured.
Below we will first explain the working principle of burst pulse measurement using wide video bandwidth and limited video bandwidth peak power meters, then introduce the working process of USB average power sensor, and examine the relative measurement accuracy of all technologies. Only by understanding the working principle of these power meters and sensors can you ensure that you choose the right power meter to obtain accurate and reliable measurement results.
The impact of the peak power meter's video bandwidth being smaller than the measured signal's bandwidth on the measurement
The video bandwidth of the peak power meter is an important parameter for peak power and average power measurement. In order to ensure the accuracy of peak power and average power measurement, the bandwidth of the power meter and sensor must be wider than the signal bandwidth.

Figure 1: Input power is compressed due to nonlinear diode characteristics
When the diode sensor detects the RF power envelope, it is transformed nonlinearly. In Figure 1, the red waveform represents the actual power envelope (two-tone RF signal), the blue waveform represents the signal detected at the diode output, and the green curve is the transfer function of the diode detector. We can see that although each voltage point can be inverted to represent power through the complementary inverse function, this does not apply to the average power. The call-out function in the figure above can illustrate this. Settling at the average level is a limitation of sensors with reduced bandwidth, which will cause errors. In order to maintain accuracy, each sample of the detector is corrected before the average is calculated. If the bandwidth is insufficient, the relationship between the actual voltage and the detected voltage depends entirely on the level and characteristics of the signal, so the average cannot be calculated.
In other words, the video bandwidth 'pre-averages' the voltage waveform before applying linearity correction, resulting in an underestimation of the overall power measurement for both average and peak power (see Figure 2(A)).
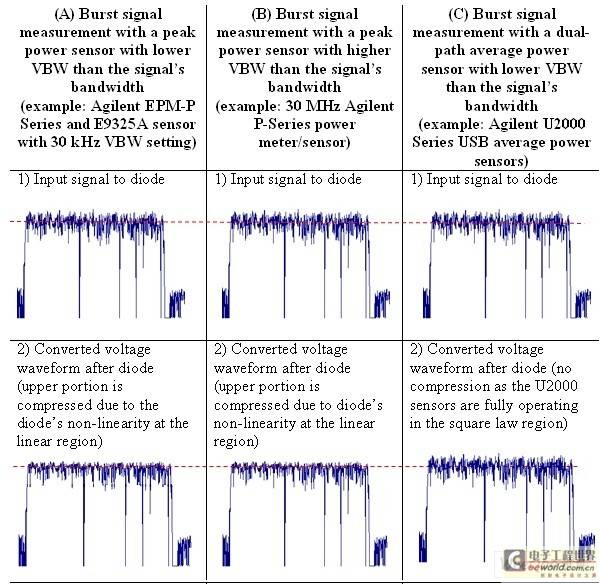
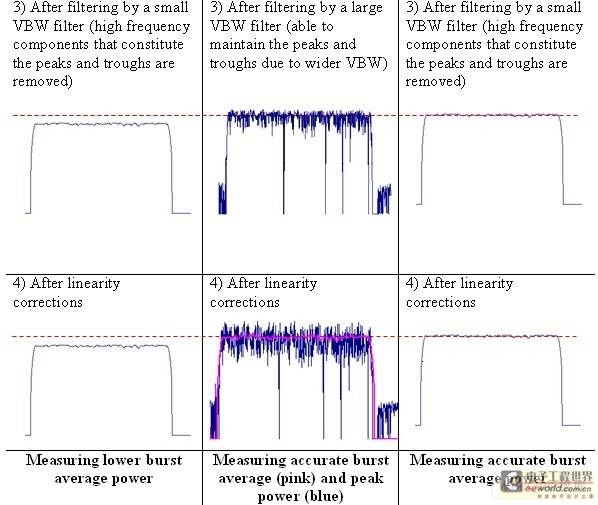
Figure 2: Accuracy of measuring average power of a broadband signal burst under the following conditions: (A) The video bandwidth of the power meter and sensor is less than the signal bandwidth; (B) The video bandwidth of the power meter and sensor is greater than the signal bandwidth; (C) The average power sensor uses a dual-channel diode and operates entirely in the square law region
Burst Power Measurements Using a Wide Video Bandwidth Peak Power Meter
In contrast, if the same measurement is made using a wide bandwidth power meter, there is no 'pre-averaging' of the power samples by the video bandwidth filter. Although the top portion of the voltage waveform is compressed due to the nonlinear behavior of the diode in the linear region, signal details such as peaks and valleys are still preserved in the voltage waveform after the filter. Each voltage sample is then linearly corrected and 'decompressed' to obtain the original waveform. Therefore, the wide bandwidth peak power meter is able to make accurate peak power measurements and average power measurements (see Figure 2(B)).
Burst Power Measurements Using USB Average Power Sensors
With the advancement of digital technology in recent years, it is now possible to use smaller power sensors for highly accurate, repeatable and fast power measurements. Standalone sensors can perform power-to-voltage conversion, data acquisition, temperature correction, power linearity correction, frequency correction, and all measurement controls without the need for a power meter. The new U2000 series USB power sensors use a dual-channel diode structure that can not only perform true average power measurements, but also use the time gating function to accurately measure the average power of burst pulses - users can set a pair of gates near the burst pulse signal and then measure the average power within the gate. Although the sensor's video bandwidth is only a few tens of kHz, it can still provide an accurate signal envelope profile because its dual-channel diode structure can operate completely in the square law region. [page]
Unlike peak sensors, with average power sensors, the top portion of the voltage waveform is not compressed due to the nonlinearity of the diode. Therefore, the U2000 series can convert the burst power into a voltage waveform proportionally, which is then corrected for video bandwidth through the sensor's RC filter circuit. The RC filter has a bandwidth of tens of kHz and can filter out the high-frequency components that make up the peaks and valleys of the burst signal in the time domain. However, the average power will remain unchanged, and the U2000 sensor can still provide an accurate signal envelope profile, thereby obtaining an accurate burst average power measurement result (see Figure 2(C)).
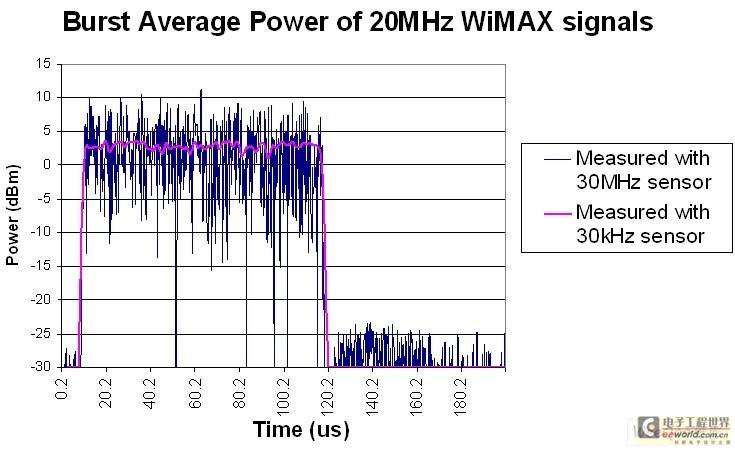
Figure 3: The burst average power of a WiMAX 20 MHz signal is measured using two different sensors (30 MHz and 30 kHz sensors).
The following figure is an example of a power/time plot of a WiMAX 20MHz signal measured using a sensor with a 30MHz and 30kHz video bandwidth. The 30MHz wide bandwidth sensor retains the details of the OFDM signal, including the detailed peaks and valleys, while the 30kHz bandwidth sensor filters out the high frequency components and only retains the envelope of the OFDM signal. The average power measured by both sensors is roughly the same, while the peak power measured by the 30kHz sensor is significantly lower.
WiMAX and WLAN Measurements Using U2000 Series USB Power Sensors
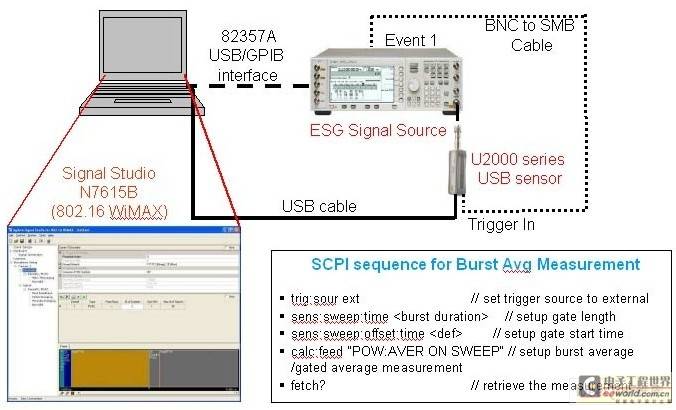
Figure 4: Burst average power measurement setup using an ESG signal generator and a U2001A USB power sensor
This section explains the measurement setup and accuracy of using a U2000 sensor to measure a WiMAX 802.11e 28MHz signal and a WLAN 802.11g 20MHz signal, and compares it to the measurement setup and accuracy using a 30MHz P-Series power meter and sensor and a 300kHz E9325A power sensor (Figure 5).

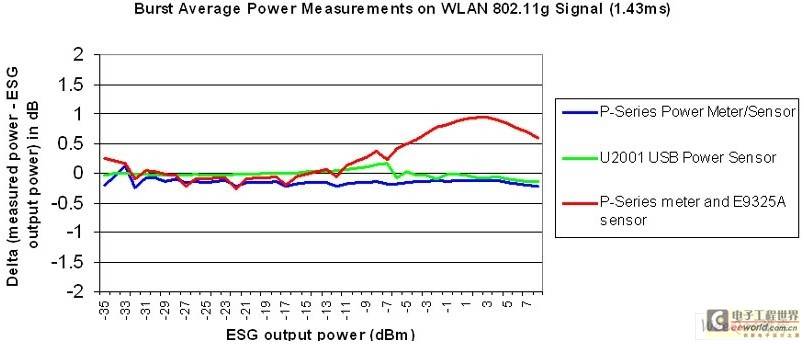
Figure 5: Comparison of burst average power measurements for broadband WiMAX and WLAN signals
The P-Series N1911A/12A power meters and N1921A/22A sensors provide the most accurate measurements with their flat and wide 30MHz video bandwidth. The E9325A has a 300kHz video bandwidth and provides good accuracy up to -10dBm, with the square-law region of the diodes up to -10dBm. Above -10dBm, the measurements start to deviate due to its limited video bandwidth and the nonlinearity of the diodes at high power levels. The U2000 Series, despite its limited video bandwidth, is able to perform accurate measurements on wide bandwidth WiMAX signals due to its dual-channel diode structure and full square-law operation. The U2000 sensors also offer some other advantages, such as faster measurement speeds and more affordable prices. Table 1 compares the results of burst power measurements performed by the P-Series power meters and the U2000 Series USB power sensors.
Table 1

Previous article:Antenna switch cabinet system network performance test and evaluation
Next article:Dual G ultra-wideband mobile phone built-in antenna
Recommended ReadingLatest update time:2024-11-15 14:43


- Popular Resources
- Popular amplifiers
-
 Analysis and Implementation of MAC Protocol for Wireless Sensor Networks (by Yang Zhijun, Xie Xianjie, and Ding Hongwei)
 -
 Introduction to Internet of Things Engineering 2nd Edition (Gongyi Wu)
 -
 西门子S7-12001500 PLC SCL语言编程从入门到精通 (北岛李工)
 -
 Modern Motor Control Technology (Wang Chengyuan, Xia Jiakuan, Sun Yibiao)
- From probes to power supplies, Tektronix is leading the way in comprehensive innovation in power electronics testing
- Seizing the Opportunities in the Chinese Application Market: NI's Challenges and Answers
- Tektronix Launches Breakthrough Power Measurement Tools to Accelerate Innovation as Global Electrification Accelerates
- Not all oscilloscopes are created equal: Why ADCs and low noise floor matter
- Enable TekHSI high-speed interface function to accelerate the remote transmission of waveform data
- How to measure the quality of soft start thyristor
- How to use a multimeter to judge whether a soft starter is good or bad
- What are the advantages and disadvantages of non-contact temperature sensors?
- In what situations are non-contact temperature sensors widely used?
- LED chemical incompatibility test to see which chemicals LEDs can be used with
- Application of ARM9 hardware coprocessor on WinCE embedded motherboard
- What are the key points for selecting rotor flowmeter?
- LM317 high power charger circuit
- A brief analysis of Embest's application and development of embedded medical devices
- Single-phase RC protection circuit
- stm32 PVD programmable voltage monitor
- Introduction and measurement of edge trigger and level trigger of 51 single chip microcomputer
- Improved design of Linux system software shell protection technology
- What to do if the ABB robot protection device stops
- Analysis of the application of several common contact parts in high-voltage connectors of new energy vehicles
- Wiring harness durability test and contact voltage drop test method
- From probes to power supplies, Tektronix is leading the way in comprehensive innovation in power electronics testing
- From probes to power supplies, Tektronix is leading the way in comprehensive innovation in power electronics testing
- Sn-doped CuO nanostructure-based ethanol gas sensor for real-time drunk driving detection in vehicles
- Design considerations for automotive battery wiring harness
- Do you know all the various motors commonly used in automotive electronics?
- What are the functions of the Internet of Vehicles? What are the uses and benefits of the Internet of Vehicles?
- Power Inverter - A critical safety system for electric vehicles
- Analysis of the information security mechanism of AUTOSAR, the automotive embedded software framework
- Guess: What is the origin of the code name of the open source "Wanli" Raspberry Pi car that went viral yesterday?
- [Silicon Labs Development Kit Review] +Si7021 Temperature and Humidity Sensor Detection
- RISC-V RVB2601 first experience--Section 3--IO simulation serial port completed
- [HC32F460 Development Board Review] (Part 5) On-Chip Programmable Gain Amplifier (PGA) Review
- Infineon Development Board 618 Promotion: The hot-selling list is revealed, with great gifts!
- Are there any people using Chinese MCU or Huada MCU in the forum?
- In the if else statement in C language, there is only one line of code after if. What is the impact of adding a semicolon after it?
- How to migrate SES project from GNU toolchain to Segger toolchain?
- 【GD32450I-EVAL】+ 09 Ethernet module test
- How to judge whether an operational amplifier is good or bad

 Analysis and Implementation of MAC Protocol for Wireless Sensor Networks (by Yang Zhijun, Xie Xianjie, and Ding Hongwei)


 京公网安备 11010802033920号