Frequency refers to the number of times a periodic phenomenon is repeated per unit time, and it is mathematically the reciprocal of time. The precise measurement of time frequency has promoted the development of science, and the development of science has in turn raised the measurement of time frequency to a new level. Especially in recent decades, the measurement accuracy of frequency and time has reached a very high level, far exceeding the measurement accuracy of all other physical quantities. Its main application areas include navigation and communication, as well as space technology, industrial production, transportation, scientific research, astronomy and metrology.
In order to meet the requirements of modern technology development, new frequency meters all use single-chip microcomputers for data processing. In this way, software replaces complex hardware circuits, simplifying the structure of the instrument and enhancing its functions. This paper presents a simple frequency measurement method based on TMS320F2812 (F2812 for short) DSP. This method effectively utilizes the capture function of the on-chip external event manager of F2812 to capture and count at the effective level transition edge of the measured signal. The circuit is mostly implemented by software settings, with simple calculation, good real-time performance and high measurement accuracy.
1 Measurement method
Commonly used frequency measurement methods include direct frequency measurement, direct period measurement and multi-cycle measurement. Although the direct frequency measurement method has higher accuracy in the high frequency band, it has lower accuracy in the low frequency band, while the direct period measurement method is just the opposite. The multi-cycle measurement method is to input the measured signal and the standard signal into two counters respectively. Its actual gate time is not a fixed value, but an integer multiple of the period of the measured signal. Therefore, the counting error of ±1 Hz generated when counting the measured signal is eliminated, and its accuracy is only related to the gate time and the standard frequency. Therefore, this design adopts the multi-cycle measurement method as a specific implementation plan.
2 System Design
2.1 System Hardware Design
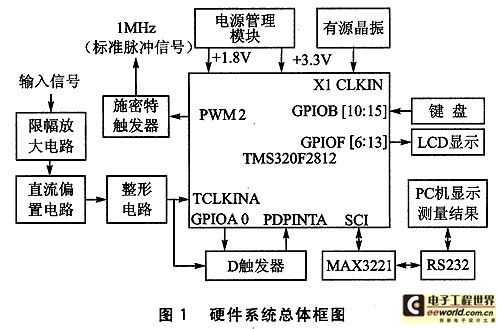
The overall block diagram of the hardware system is shown in Figure 1. The measured signal first passes through the limiting amplifier, DC bias, and shaping circuit to be converted into a 0-3.3 V square wave signal, and then enters the DSP, using its timer and capture unit to achieve frequency measurement. After the measurement is completed, on the one hand, the relevant parameters can be set by the keyboard to display the measurement results on the LCD, and on the other hand, the measurement results can be transmitted to the PC through RS-232 to display the measurement results. In addition, in order to improve the reliability of the system, a self-calibration circuit is added, that is, before the measurement, a 1 MHz standard pulse signal can be generated through the software setting and sent to the input end of the signal conditioning module to detect whether the measurement result is correct, thereby achieving the purpose of self-calibration.

This design uses the TMS320F2812 DSP of Texas Instruments (TI) as the core processing unit. F2812 is a high-speed, high-precision industrial control DSP chip launched by TI in recent years. It has a fast computing speed, a working clock frequency of 150 MHz, an instruction cycle of less than 6.67 ns, and low power consumption (core voltage 1.8 V, I/O port voltage 3.3 V). It adopts the Harvard bus structure and has powerful operating capabilities; peripheral devices include 3 32-bit CPU timers, 16-channel 12-bit A/D converters, serial peripheral interfaces (
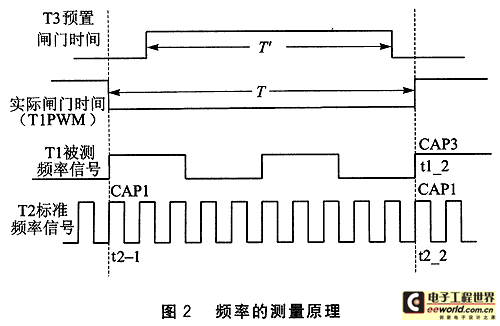
SPI), 2 serial communication interfaces (SCI), etc. Its on-chip peripheral time manager contains 2 modules (EVA and EVB), each of which includes 2 general timers, 3 full comparison/PWM units, 3 capture units and 1 orthogonal encoding pulse circuit. This design mainly uses 2 general timers (T1 and T2), 2 capture units (CAP1 and CAP3) in EVA, and 1 general timer (T3) in EVB. The specific measurement principle is shown in Figure 2.

First, set the T3 comparison value (preset gate time is 0.012 8 s), set the T1 comparison value to 1, and enable CAP1. Then enable T1, and when it receives a full cycle of the measured signal, it can generate a comparison output, and at the same time generate a comparison interrupt, read the stack value of CAP1 (that is, the initial value of T2 t2_1), clear the overflow times of T1 and T2, and enable CAP3 and T3. Finally, when the T3 timing ends, with the help of the D flip-flop, when the next rising edge of the measured signal arrives, the comparison output of T1 is cut off, and PDPINTA will be set at the same time, and then the overflow times tlofcount and t2ofcount of T1 and T2 are recorded, and the stack value of CAP1 (that is, the final value t2_2 of T2) and the stack value of CAP3 (that is, the final value tl_2 of T1) are read. Calculate the frequency from the obtained data, and disable T1, T2, CAP1 and CAP3. The frequency calculation formula is:

Note: The capture time base of CAP1 is T2, the capture time base of CAP3 is T1, and the standard frequency signal is 8 divided by the 150 MHz clock frequency.
2.2 System software design
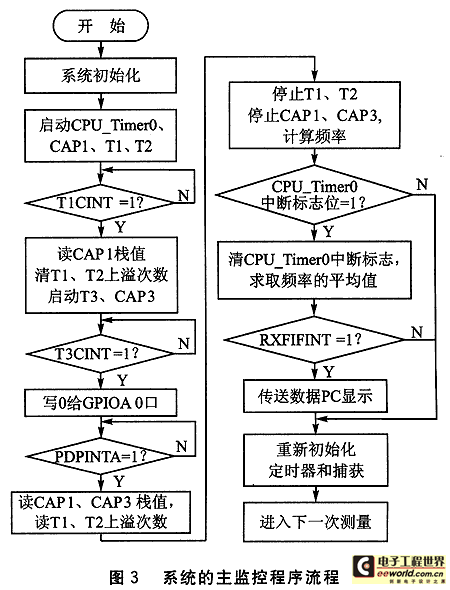
The main monitoring program is the general scheduler of the entire software system, which controls the orderly operation of the program. After the system is powered on or reset, the main program first calls the initialization subroutines of each module, mainly including GPIO initialization, PIE initialization, EV initialization and SCI initialization. After the system initialization is completed, the main program starts CPU_Timer0, enables the overflow interrupts of T1 and T2, starts CAP1, sets the comparison value of T1 to 1, waits for T1CINT to be set, and starts measuring the frequency. In order to reduce the random errors generated during the measurement process, the measured results are averaged. CPU_Timer0 is used to generate a certain time period (0.6s). After the end of this period (CPU_Timer0 interrupt flag is set), the measurement results recorded in this period are averaged. At this time, if the host computer sends a receive request, the corresponding data is transmitted to the PC for display. Then, the timer and capture unit are reinitialized to enter the next round of measurement. The main monitoring program flow is shown in Figure 3.

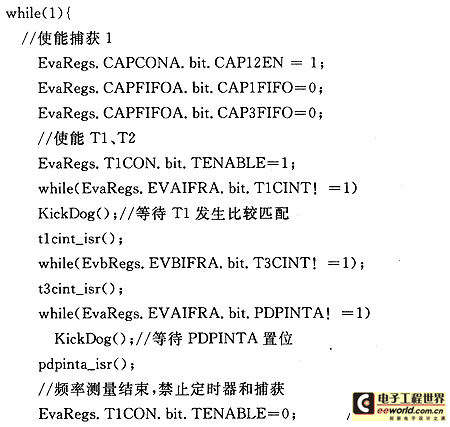
Part of the source code for frequency measurement is as follows:

3 Error analysis and test results
3.1 Quantization Error
Assume that the frequency of the measured signal is Fx, its true value is Fxe, and the standard frequency is Fs. In a measurement, the preset gate time is T′, Tpr is the actual gate time, the count value of the measured signal is Nx, and the count value of the standard frequency signal is Ns.
The start and stop time of Fx counting is triggered by the rising edge of the signal. Within the T′ time, the count Nx of Fx is error-free, and the count Ns of Fs is assumed to differ by N pulses, that is, |△et|≤n.
Since Fx/Nx=Fs/Ns, Fxe/Nx=Fs/(Ns+△et), according to the relative error formula:
Therefore, the following conclusions can be drawn:
①Relative measurement error has nothing to do with the frequency of the measured signal.
②Increasing T' or increasing Fs can increase Ns, reduce measurement errors, and improve measurement accuracy. In this design, the preset gate time limits the minimum measurement accuracy.
③ The n in the error analysis is mainly determined by the time required for the hardware to cut off T1PWM, which is a small integer constant. If the preset gate time Tpr = 0.012 8 s, then
Even if n is a small integer constant other than 1, the accuracy can still be maintained within one hundred thousandth, and can be further improved as the preset gate time is appropriately extended.
3.2 Principle error of measurement and standard frequency error
The measurement principle is similar to the multi-cycle synchronous measurement principle. The main principle error comes from the low-level jump generated by the D trigger to cut off T1PWM when the measurement is about to end, so that it generates a jump of the rising edge captured by CAP1 and CAP3 at the same time. This period of time is mainly determined by the reaction time of the D trigger. During the measurement process, this part of the error can be overcome by appropriately increasing the time of the preset gate. At the same time, considering the high-speed clock frequency inside the DSP, this will not significantly increase the measurement time, but it achieves the purpose of weakening the influence of this error and increasing the measurement accuracy.
The standard frequency error is △Fs/Fs. Because the crystal is very stable, the standard frequency error can be calibrated, and the high-speed clock frequency inside the DSP has been appropriately divided, so the calibrated standard frequency error can be ignored compared to the quantization error.
3.3 Test Results
A function signal generator (Tektronix AFG3010; accuracy 0.000 1%) is used to generate a square wave signal, and the frequency is measured with the designed frequency meter to find the error. The measurement accuracy of this frequency measurement system can reach 0.01%. According to the error analysis, the maximum error of the system occurs when the preset gate time just fills an integer number of measured signals, that is, when the frequency is 78.125 Hz or its integer multiple, so these points are selected for testing. The actual test data is listed in Table 1.
4 Conclusion
This article focuses on the design of the digital frequency meter, the hardware composition, and the software design of the communication between the host computer and the slave computer using the
Modbus protocol. Features include:
① In terms of frequency measurement principle, due to the use of multi-cycle measurement principle, the ±1 counting error generated when counting the measured signal is eliminated, and its accuracy is only related to the gate time and the standard frequency, overcoming the shortcomings of traditional frequency measurement method or cycle measurement method, and realizing wide range and high-precision frequency measurement. At the same time, due to the existence of preset gate time, it is ensured that when the measured frequency switches back and forth between frequency bands, the system responds sensitively and has good following performance.
② In terms of the overall design of the system, the internal resources of the F2812 DSP are fully utilized, that is, the timer and capture unit in the event manager are used to complete the frequency measurement; the PWM output is used to realize the design of the self-test circuit; and the serial communication module is used to complete the communication between the upper and lower computers. In terms of the display of the measurement results, RS232 is used, and the communication protocol adopts the Modbus protocol to realize the communication between the lower and upper computers, and the measurement results are displayed in the upper computer.
This article only discusses how to measure the frequency of a single-channel signal. For multi-channel signals, you can first pass them through an AND gate, use software to determine which signal is which, and then use this design method to measure. The error problem caused by this situation needs further discussion, and this article only gives a preliminary exploration.


 Professor at Beihang University, dedicated to promoting microcontrollers and embedded systems for over 20 years.
 MATLAB and FPGA implementation of wireless communication


 京公网安备 11010802033920号