When customers use oscilloscopes to measure vertical quantities such as the amplitude/peak value of high-frequency signals, strong voltages, tiny signals, or power supply ripples, noise, etc., the measured values may deviate, such as being too small or too large, causing users to question the measurement accuracy of the oscilloscope.

Figure 1 Oscilloscope measurement question
The reasons for the deviation of the oscilloscope vertical measurement can be attributed to the following four points:
① Whether the low frequency compensation is adjusted;
② The impact of the oscilloscope's background noise on the measurement;
③ Differences in the amplitude-frequency characteristic curves of the oscilloscope;
④ The impact of the oscilloscope's vertical resolution on the measurement.
Display analysis:
1. Due to the visual afterglow effect of the human eye and the limitation of LCD refresh rate (about 50 frames per second), the waveform frames are superimposed first and then displayed;
2. As shown in the example above, the oscilloscope performs n sampling, aligns based on the trigger position, superimposes n frames of waveform data, and then sends them for display;
3. In the end, what we see is the effect of "waveform overlay display".
Of course, the measurement accuracy of an oscilloscope is not necessarily comparable to that of a high-precision multimeter, so if you want to measure more accurate data in the vertical measurement of an oscilloscope, you need to master the correct operating skills.
1. Whether low frequency compensation is adjusted or not
Low frequency compensation (LFC) requires the use of a square wave in the kHz range (usually 1KHz or 10KHz) to adjust the frequency response of the X10 probe. When performing low frequency compensation, connect the probe to a kHz square wave signal. If over-compensation or under-compensation occurs, use the low frequency adjustment rod to adjust the probe's low frequency compensation capacitor to the square wave flat top.

Figure 2 Waveform compensation
Why is low-frequency compensation necessary?
As shown in Figure 3 below, this is the internal circuit diagram when the probe is connected to the oscilloscope input terminal. R1 is a 9MΩ series resistor, which forms a 10:1 attenuator with the 1MΩ input resistor at the oscilloscope input terminal, which can effectively reduce the input capacitance and is beneficial to the measurement of high-frequency signals.
When using an X10 probe to measure signals, the impact of capacitive load becomes more obvious as the signal frequency increases. At this time, the parasitic capacitance (Cp, Cc) of the probe and cable in the probe body will cause impedance mismatch between the probe and the oscilloscope (R1xC1≠R2x(C2+Cc)), thereby affecting signal measurement.
Due to the inconsistency of parasitic capacitance, C1 needs to be made into an adjustable capacitor to compensate for the influence of parasitic capacitance, so that R1xC1=R2x(C2+Cc), so that the probe and oscilloscope can be matched. Since the resistance values of R1 and R2 are relatively large, the pole frequency formed by R1, C1, R2, and C2 is relatively low, so this capacitor is also called a low-frequency compensation capacitor.

Figure 3 Probe compensation circuit
The impact of low-frequency compensation on signal vertical measurement:
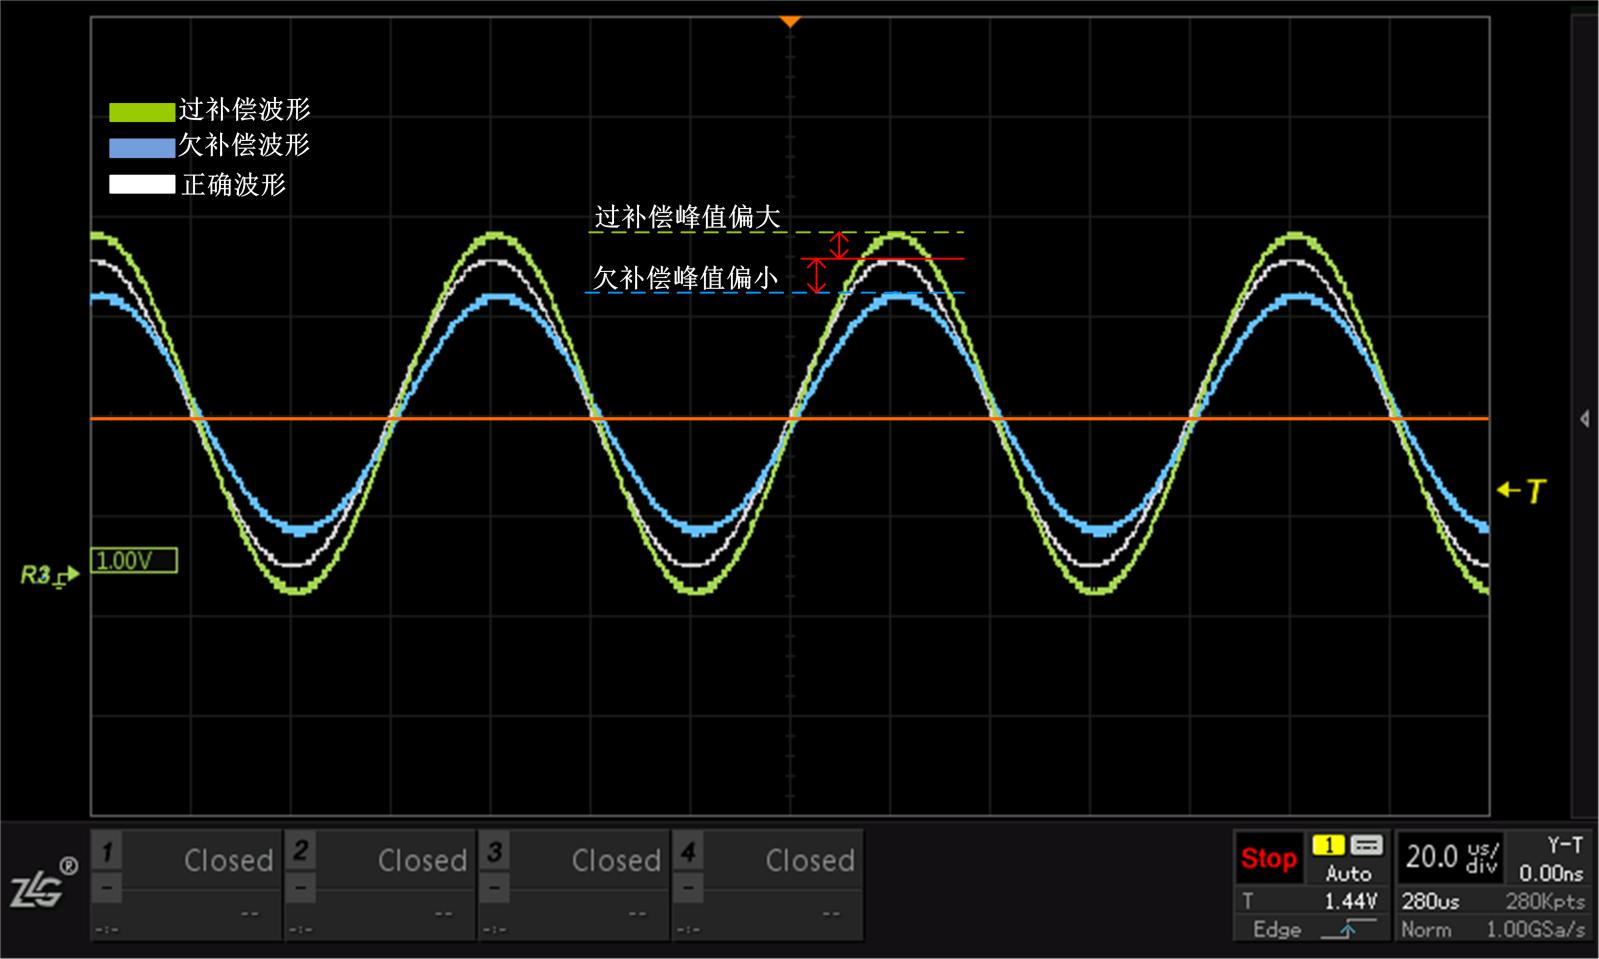
Taking the measurement of the peak-to-peak value of a sine wave as an example, in the case of under-compensation, the vertical value of the waveform will be too small, and in the case of over-compensation, the vertical value will be too large, as shown in Figure 4 below.

Figure 4 Changes in waveform amplitude under different compensations
2. The impact of the oscilloscope's background noise on the measurement
Noise Floor:
It usually refers to the "baseline noise floor" of the oscilloscope, which is the vertical noise caused by the analog front end and digital conversion process of the oscilloscope. The size of the noise floor is expressed by the signal-to-noise ratio. The larger the value, the smaller the noise interference of the signal, that is, the smaller the noise floor of the measuring instrument.
The impact of background noise on vertical measurement:
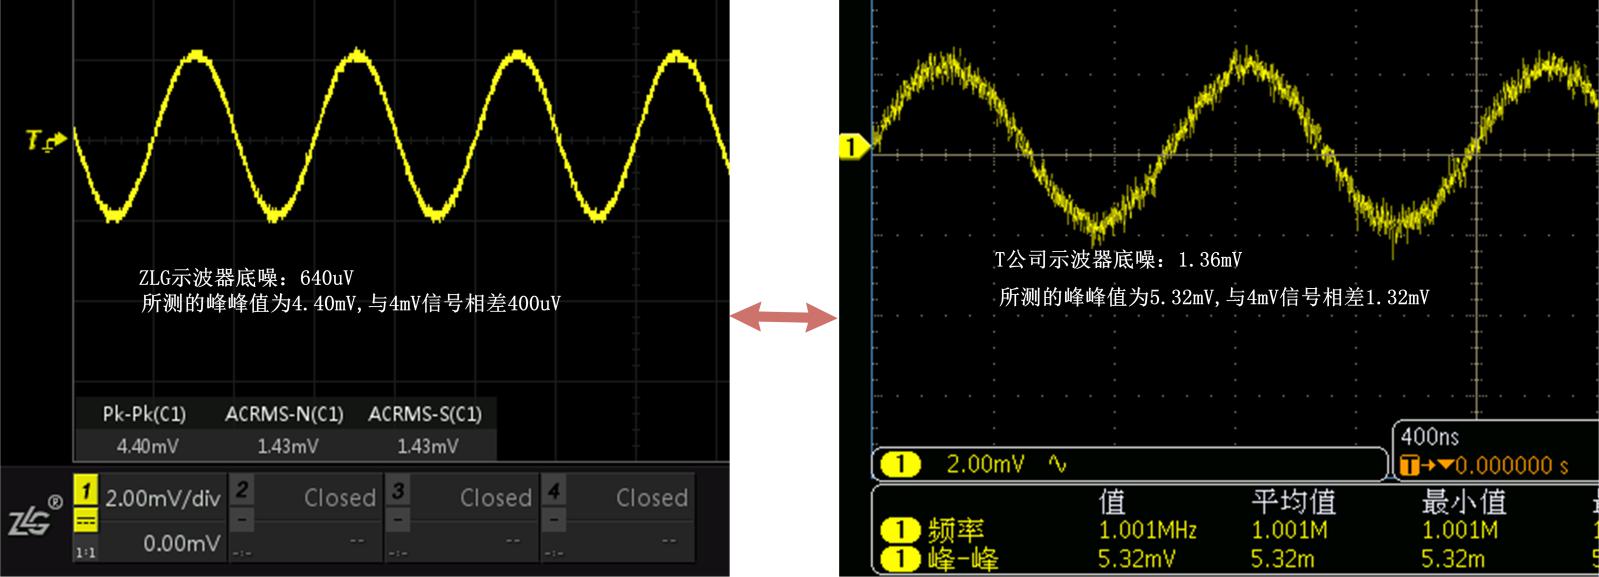
The noise floor is displayed on the oscilloscope screen as the noise waveform generated when the oscilloscope is set to the most sensitive vertical position. Of course, the noise floor of the oscilloscope is related to the components used in the instrument, hardware design, signal processing, etc., so the noise floor of oscilloscopes from different companies or different models is different, as shown in Figure 5.

Figure 5 Oscilloscopes from different companies have different noise floors
⑴ When the background noise of the oscilloscope is large, it will mask the small signal, affecting the accuracy of the tiny signal measurement and causing inaccurate vertical measurement;
⑵ When the oscilloscope has a low noise floor, the signal measurement will be more accurate;
As shown in Figure 6 below, a 4mV peak-to-peak sinusoidal signal is input into two oscilloscopes from different companies, and their peak-to-peak values are measured to understand the effect of background noise on the measurement.

Figure 6 Comparison of peak-to-peak measurements of oscilloscopes from different companies
If you want to reduce the impact of background noise on the measurement, you can use the following methods:
(1) The oscilloscope's capture mode uses "average" capture. Average capture can average the periodic signals triggered multiple times, making the signal fluctuate slightly around a certain value, closer to the true value, and reducing the impact of noise.
(2) The oscilloscope can use "digital filtering" to filter out noise signals greater than the cutoff frequency (less than the cutoff frequency) under low-pass filtering (high-pass filtering) to improve measurement accuracy.
3. Amplitude-frequency characteristic curve of oscilloscope
Bandwidth: refers to the analog bandwidth of the oscilloscope's analog front end. Its size directly determines the signal frequency range that the oscilloscope can measure.
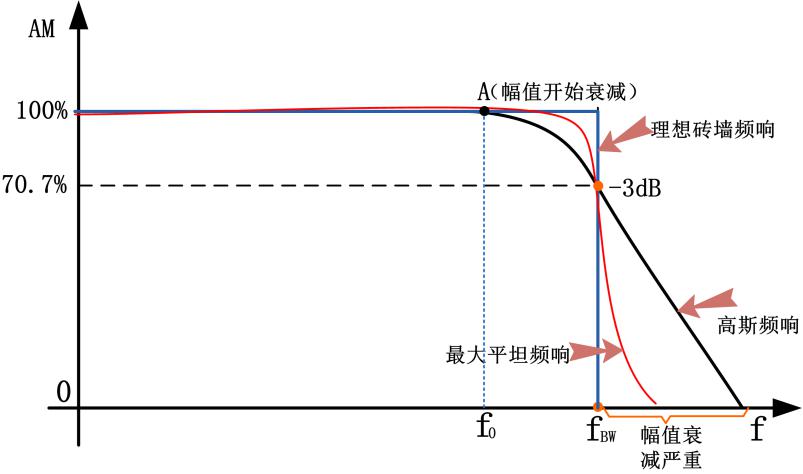
Specifically, the bandwidth of an oscilloscope refers to the highest frequency when the amplitude of the sine wave measured by the oscilloscope is not less than the -3dB amplitude of the real sine wave signal (i.e. 70.7% of the real signal amplitude), also known as the -3dB cutoff frequency point. As the signal frequency increases, the oscilloscope's ability to accurately display the signal will decrease. Figure 7 shows the ideal amplitude-frequency characteristic curve.
The amplitude-frequency characteristic curve of an oscilloscope refers to the curve in which the amplitude of the oscilloscope signal changes with the increase of the signal frequency.

Figure 7 Ideal amplitude-frequency characteristic curve
As shown in Figure 7 above, when the frequency of the measured signal is equal to the bandwidth (fBW) of the oscilloscope, the error of the amplitude measurement result is about 30%. The amplitude of the signal with a frequency less than f0 is basically not attenuated. The signal starts to slowly attenuate between f0 and fBW, and the signal attenuation becomes more and more serious when it is greater than fBW. Therefore, if you want to reduce the attenuation of the signal amplitude, the frequency of the measured signal should be much smaller than the bandwidth value.
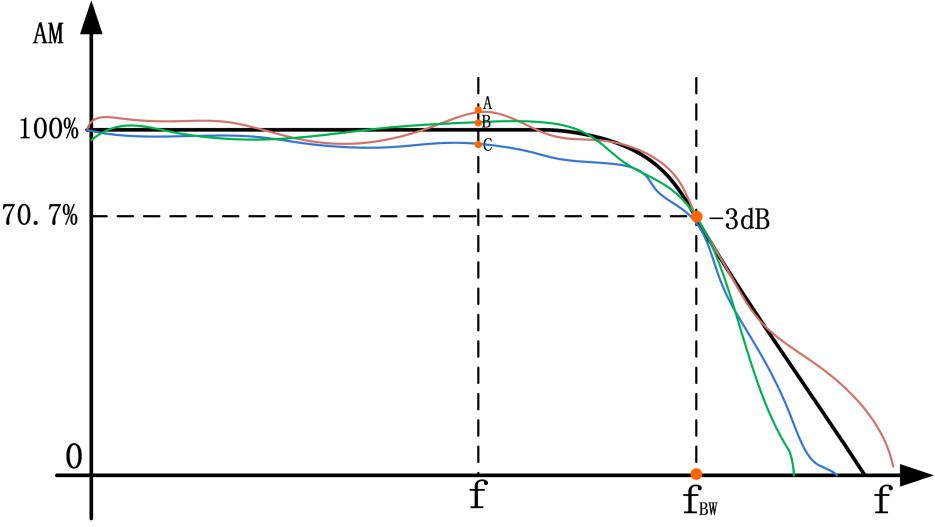
Figure 8 shows an ideal amplitude-frequency characteristic curve, but the shape of the actual amplitude-frequency characteristic curve of an oscilloscope cannot be ideal. The amplitude-frequency characteristics of different models of oscilloscopes may be different, but they will try to approach the shape of the ideal curve.

Figure 8 Actual amplitude-frequency characteristic curve
Figure 8 is a schematic diagram of a non-ideal amplitude-frequency characteristic curve. The flatness of different amplitude-frequency characteristic curves of different oscilloscopes is different, but the in-band attenuation is within -3dB and meets the standard. Therefore, the amplitude attenuation of the signal at the same frequency point of different oscilloscopes may be different, which leads to the deviation of amplitude measurement of different oscilloscopes.
4. The impact of the oscilloscope's vertical resolution on measurement
Generally, digital oscilloscopes use 8-bit ADC, and any waveform value is reorganized with 256 0s and 1s. Assuming that the vertical full scale of the oscilloscope is 8 grids, the corresponding quantization level is 256. When the vertical scale is 500mV/div, the vertical accuracy is (500mV*8)/256=15.625 mV. When measuring the same signal, when the vertical scale is 50mV/div, that is, (50mV*8)/256=1.5625 mV, the vertical accuracy reaches 1.5625 mV.

Figure 9 Measurement accuracy
In actual measurement, due to the different amplitudes of the measured waveforms, the vertical scale settings will also be different. However, in order to make the measurement as accurate as possible, the following operations can be performed:
Make the test signal amplitude occupy about 6 div of the screen as much as possible. For example, for a sine wave with a peak-to-peak value of 7Vpp, the vertical scale should be set to 1V/div, not 2V/div or 5V/div. In fact, this involves a problem of voltage resolution. The quantization resolution of the ADC of the ZDS4054 plus oscilloscope is 25LSB/div. For example, at 1V/div voltage, the voltage resolution is 40mv, while at 10V/div, the voltage resolution is 400mv. It can be seen that at 1V/div, the measured value has a higher resolution and is more accurate.
Summarize
In summary, an oscilloscope can observe the overall trend of waveform changes. The core of the oscilloscope is high bandwidth, high sampling rate, and high refresh rate, and it tends to measure high-speed signals. If you want to perform high-precision vertical measurement of low-speed signals, it is recommended to use a high-precision multimeter and power analyzer.
Previous article:Always pay attention to the oscilloscope sampling rate, just like you always pay attention to the speedometer when driving.
Next article:Securing your train communications - MVB
- Keysight Technologies Helps Samsung Electronics Successfully Validate FiRa® 2.0 Safe Distance Measurement Test Case
- From probes to power supplies, Tektronix is leading the way in comprehensive innovation in power electronics testing
- Seizing the Opportunities in the Chinese Application Market: NI's Challenges and Answers
- Tektronix Launches Breakthrough Power Measurement Tools to Accelerate Innovation as Global Electrification Accelerates
- Not all oscilloscopes are created equal: Why ADCs and low noise floor matter
- Enable TekHSI high-speed interface function to accelerate the remote transmission of waveform data
- How to measure the quality of soft start thyristor
- How to use a multimeter to judge whether a soft starter is good or bad
- What are the advantages and disadvantages of non-contact temperature sensors?
- Innolux's intelligent steer-by-wire solution makes cars smarter and safer
- 8051 MCU - Parity Check
- How to efficiently balance the sensitivity of tactile sensing interfaces
- What should I do if the servo motor shakes? What causes the servo motor to shake quickly?
- 【Brushless Motor】Analysis of three-phase BLDC motor and sharing of two popular development boards
- Midea Industrial Technology's subsidiaries Clou Electronics and Hekang New Energy jointly appeared at the Munich Battery Energy Storage Exhibition and Solar Energy Exhibition
- Guoxin Sichen | Application of ferroelectric memory PB85RS2MC in power battery management, with a capacity of 2M
- Analysis of common faults of frequency converter
- In a head-on competition with Qualcomm, what kind of cockpit products has Intel come up with?
- Dalian Rongke's all-vanadium liquid flow battery energy storage equipment industrialization project has entered the sprint stage before production
- Allegro MicroSystems Introduces Advanced Magnetic and Inductive Position Sensing Solutions at Electronica 2024
- Car key in the left hand, liveness detection radar in the right hand, UWB is imperative for cars!
- After a decade of rapid development, domestic CIS has entered the market
- Aegis Dagger Battery + Thor EM-i Super Hybrid, Geely New Energy has thrown out two "king bombs"
- A brief discussion on functional safety - fault, error, and failure
- In the smart car 2.0 cycle, these core industry chains are facing major opportunities!
- The United States and Japan are developing new batteries. CATL faces challenges? How should China's new energy battery industry respond?
- Murata launches high-precision 6-axis inertial sensor for automobiles
- Ford patents pre-charge alarm to help save costs and respond to emergencies
- New real-time microcontroller system from Texas Instruments enables smarter processing in automotive and industrial applications
- EEWORLD University ---- Matlab Machine Learning
- How embedded hardware and software systems work
- Help: How to reduce the power consumption of the solenoid valve coil
- hc32f460
- Design of wireless communication terminal system realized by USB to UART technology and wireless technology
- How to write arm-poky mixed Makefile
- Inductor and capacitor selection for flyback circuit
- Single-ended input and double-ended output circuit
- When calculating the circuit branch current and component voltage, how to determine whether the selected loop group is an independent loop using the loop current method?
- Evaluation summary: Domestic FPGA Gaoyun GW1N series development board

 Chip Manufacturing: A Practical Tutorial on Semiconductor Process Technology (Sixth Edition)
 Application of static fields


 京公网安备 11010802033920号