Like most test tools, modern digital storage oscilloscopes (DSOs) have evolved to meet the needs of designers and test engineers, balancing performance, features, and usability. However, its three basic features - graticules, cursors, and automatic measurement parameters - have remained constant because, when used correctly, they are extremely valuable to designers facing ever-increasing time-to-market pressures.
This article will explain how to properly use and apply these basic characteristics of a modern DSO and provide practical definitions of the measurement parameters for reference.
Three essential tools for the modern DSO
An oscilloscope is a voltage-response measuring instrument that includes three basic measurement tools. These tools have continued to evolve as the instrument has evolved. The earliest tool was the display graticule or grid on the instrument display. The second tool introduced in the development of the oscilloscope was the cursor or marker. The last and third tool added were the measurement parameters. These parameters were added with the introduction of digital oscilloscopes. It is a testament to their usefulness that these tools have not been replaced by new technology. Let's take a look at each of these tools to help you understand why you use them and how to make the most of them.
Screen grid
The most primitive measurement technique is to use an on-screen graticule and count the divisions. This method is primarily used to quickly estimate amplitude and time measurements. Displaying a graticule or grid was the first measurement tool to appear on an oscilloscope. The measurement of a waveform is done by recording the number of divisions covered by the waveform and then multiplying by the appropriate scale factor. On a Teledyne LeCroy HDO 4104A, we have acquired a waveform showing a five-cycle sine wave (Figure 1) for which we can complete measurements.

Figure 1: Typical oscilloscope display grid. The vertical scale factor read from the trace descriptor for channel 1 (C1) is 50 millivolts (mV) per division, and the horizontal scale factor displayed in the time base descriptor is 100 ns per division. (Image source: Digi-Key Electronics)
The sine wave trace covers six divisions vertically, and multiplying by the vertical scale factor of 50 millivolts (mV) per division (see the Channel 1 descriptor box) gives us a sine wave amplitude of 300 mV (peak-to-peak). Likewise, the period of the sine wave covers two horizontal grids, and each division in the Timebase descriptor box is 100 nanoseconds (ns), giving a period of 200 ns. This method of counting divisions may seem a little primitive, but it is a very quick way to make basic measurements. Most oscilloscope users are comfortable using this method to verify basic assumptions about the waveform they are measuring and to ensure that the oscilloscope is set up correctly.
cursor
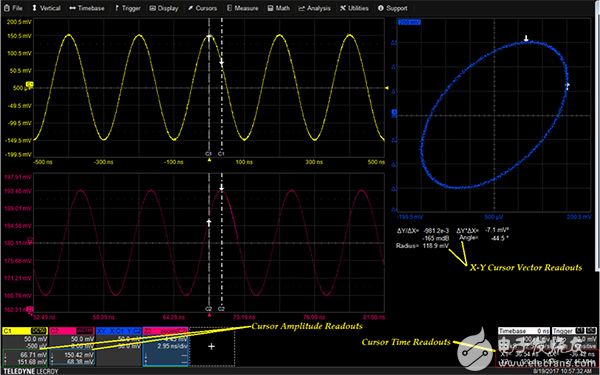
Cursors are user-placeable display lines with associated amplitude and time readouts. Cursors are placed at points on the trace where measurements are desired. Cursor readouts display amplitude, time, and the time difference between the cursor markers (Figure 2).
Figure 2: Traces and XY cursors showing cursor readout fields including amplitude and time position (Image source: Digi-Key Electronics)
The available cursor types include horizontal, vertical, and horizontal and vertical lines. The cursor type shown in the figure is a vertical line, which includes horizontal and vertical readouts for the points marked by the vertical cursor line and arrows. Amplitude readouts are displayed in the trace descriptor for each displayed channel. Horizontal readouts are located below the timebase and trigger descriptor grids. The horizontal readouts show the absolute cursor position relative to the trigger point, the time difference between the cursors (Dt), and the inverse of the time difference (frequency).
Cursor operation extends to use on the XY display. In addition to the normal amplitude and time readouts of the cursors, the user can also get readouts of the vector angle (angle from the down arrow to the up arrow) and amplitude (radius from the up arrow to the down arrow) from the XY display. These vector readouts are displayed below the XY display. Relative cursors on the XY display can read vector differences, including error vector magnitude (EVM) and phase angle.
A useful feature of XY cursors is that the cursor position on the XY display area is tracked on both the XT and YT components. Therefore, any anomaly on the XY display area can be instantly traced to the exact point on the component traces.
Measurement parameters
The most accurate way to measure a waveform is to use the automatic measurement parameters provided by the oscilloscope (Figure 3).

Figure 3: The Teledyne LeCroy HDO 4104A oscilloscope displays up to eight parameter readouts, including statistics and a “histogram.” (Image source: Digi-Key Electronics)
The Teledyne LeCroy 4104A and WaveSurfer 510 oscilloscopes offer more than 30 basic measurements, displaying up to eight or six parameters at a time, respectively. The WaveSurfer 3024 has 24 standard measurements, displaying up to six parameters at a time. Additional parameters are available in certain analysis options.
The oscilloscope measures timing parameters for each cycle of the displayed waveform. This capability is called a "full instance" measurement. Amplitude parameters accumulate a single value for each acquisition. The measurement table can show the most recent value of each measured parameter, or, with parameter statistics, a history of all measurements. The figure above shows parameter statistics turned on. Available parameter statistics include mean, minimum, maximum, and standard deviation. The total number of acquisitions (sweeps) included in the parameter statistics is also displayed. It provides the basis for statistical testing.
You can also turn on a histogram to show the distribution of the measured values for each parameter. Statistics and histograms help us understand how parameter values vary over multiple measurements.
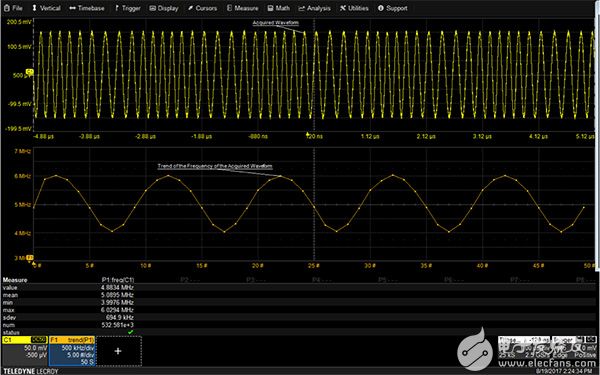
The trend function provides further insight into the changes in the measured values. The trend function plots the measured parameter values in the order in which they were measured. The vertical axis units match the measurement units and the horizontal values are the measurement sequence numbers (Figure 4).
Figure 4: Example of an instantaneous frequency trend plot of a frequency modulated sine wave. The frequency is measured at each cycle, and the values in math trace F1 are plotted in the order in which they were measured. (Image source: Digi-Key Electronics)
The acquired signal is a frequency modulated sine wave; the signal frequency is measured cycle by cycle and plotted as a trend plot in math trace F1. The vertical axis of the trend plot is in Hertz (Hz), while the horizontal axis is the measurement sequence number. Trend plots may have 20 to 1,000,000 points in a 1-2-5 progression. These trend plots are synchronized with the source trace, but must plot the same number of points.
Status icons, such as the green check mark below the statistics table, indicate the status of parameter calculations, including error conditions. If not enough data is available, the readout is blank.
These measurements can be gated so that only data within the user-defined measurement threshold is included in the measurement. This capability is very useful in many applications, such as analyzing a data bus where address and data signal waveforms share the same signal path. The measurement can be gated so that measurements are only made for the desired pattern.
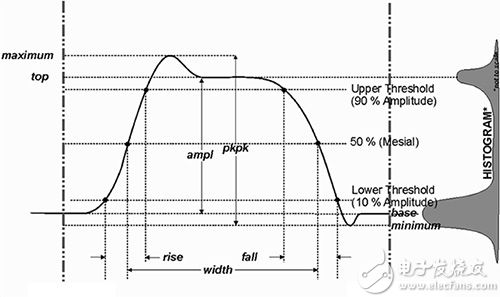
Pulse measurements are based on IEEE Standard 181. The standard states that pulse measurements must apply statistical analysis to minimize the effects of noise on pulse waveform measurements (Figure 5).
Figure 5: Example of an IEEE 181 standard pulse measurement histogram. A pulse histogram will show two peaks. The average of these peaks determines the peak and valley voltages of the pulse, minimizing the effects of noise. (Image source: Teledyne LeCroy)
The IEEE standard specifies that a histogram of the waveform samples should be plotted. A pulse histogram will have two peaks. The average of the higher peak is the pulse top, and the average of the lower peak is the pulse bottom. Using these averages eliminates the effects of noise in determining the pulse amplitude. As a result, period, width, overshoot, rise time, and fall time can all be calculated more accurately.
If the histogram fails to show two distinct peaks, the oscilloscope will indicate with a status icon that the waveform is not a pulse and that the amplitude measurement is based on maximum minus minimum or peak-to-peak.
Other specialized measurements are based on similar industry measurement standards.
Summarize
Automatic measurement parameters on an oscilloscope provide the most accurate measurements, while cursors provide greater measurement flexibility. For example, measuring the duration of a pulse train is very simple using cursors, but requires custom parameters. Similarly, grid estimation using the graticule is the quickest way to make basic measurements and is ideal for quickly verifying a test setup.
Fortunately, modern digital oscilloscope manufacturers have managed to maintain the advantages of all three aspects, helping designers to reduce the required testing time.
Previous article:Oscilloscope system and control
Next article:Comparative Analysis of Performance Indicators of Oscilloscopes and Spectrum Analyzers
- Popular Resources
- Popular amplifiers
- Seizing the Opportunities in the Chinese Application Market: NI's Challenges and Answers
- Tektronix Launches Breakthrough Power Measurement Tools to Accelerate Innovation as Global Electrification Accelerates
- Not all oscilloscopes are created equal: Why ADCs and low noise floor matter
- Enable TekHSI high-speed interface function to accelerate the remote transmission of waveform data
- How to measure the quality of soft start thyristor
- How to use a multimeter to judge whether a soft starter is good or bad
- What are the advantages and disadvantages of non-contact temperature sensors?
- In what situations are non-contact temperature sensors widely used?
- How non-contact temperature sensors measure internal temperature
- LED chemical incompatibility test to see which chemicals LEDs can be used with
- Application of ARM9 hardware coprocessor on WinCE embedded motherboard
- What are the key points for selecting rotor flowmeter?
- LM317 high power charger circuit
- A brief analysis of Embest's application and development of embedded medical devices
- Single-phase RC protection circuit
- stm32 PVD programmable voltage monitor
- Introduction and measurement of edge trigger and level trigger of 51 single chip microcomputer
- Improved design of Linux system software shell protection technology
- What to do if the ABB robot protection device stops
- CGD and Qorvo to jointly revolutionize motor control solutions
- CGD and Qorvo to jointly revolutionize motor control solutions
- Keysight Technologies FieldFox handheld analyzer with VDI spread spectrum module to achieve millimeter wave analysis function
- Infineon's PASCO2V15 XENSIV PAS CO2 5V Sensor Now Available at Mouser for Accurate CO2 Level Measurement
- Advanced gameplay, Harting takes your PCB board connection to a new level!
- Advanced gameplay, Harting takes your PCB board connection to a new level!
- A new chapter in Great Wall Motors R&D: solid-state battery technology leads the future
- Naxin Micro provides full-scenario GaN driver IC solutions
- Interpreting Huawei’s new solid-state battery patent, will it challenge CATL in 2030?
- Are pure electric/plug-in hybrid vehicles going crazy? A Chinese company has launched the world's first -40℃ dischargeable hybrid battery that is not afraid of cold
- 【GD32L233C-START Review】17. Completed work: Indoor environment monitoring equipment
- [Atria AT32WB415 Series Bluetooth BLE 5.0 MCU] Part 3: Lightble Control OLED Display
- Car sunlight sensor, urgent help
- Communication Principles_matlab.pdf
- Flyback power supply saber simulation
- Fundamentals of Spectrum Analysis
- Linux/UNIX System Programming Manual (Volumes 1 and 2)
- TMS320C6000 chip structure diagram and basic characteristics
- [ESK32-360 Review] + Serial communication and applications
- EEWORLD University Hall----Live Replay: TI's new generation of low-power Bluetooth microcontrollers helps you reduce application costs


 ISL28107FBZ-T13


 京公网安备 11010802033920号