Resistor thermal noise has always deeply affected the noise performance of amplifier circuits. People only know about resistor noise, but they are not clear about the specific details. This article will analyze the basic knowledge of resistor noise and some small tests of resistor noise. The
Thevenin noise model of resistors consists of a noise voltage source and a pure resistor, as shown in Figure 1.
The noise voltage is proportional to the square root of the resistor value, bandwidth and temperature (Kelvin). We usually quantify the noise within each 1Hz bandwidth, that is, its spectral density. In theory, resistor noise is a kind of "white noise", that is, the noise size is equal within the bandwidth, and the noise within each same bandwidth is the same.
 Figure 1
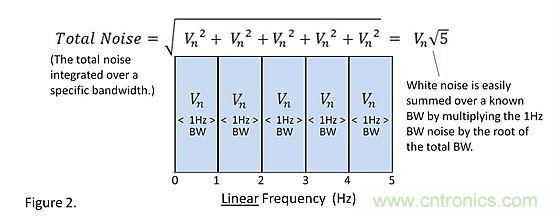
The total noise is equal to the square root of the sum of the squares of each noise. The unit of spectral density we often mention is V/ . For a 1Hz bandwidth, this value is equal to the noise size. For white noise, the spectral density is multiplied by the square root of the bandwidth to calculate the size of the total white noise within the bandwidth. In order to measure and quantify the total noise, the bandwidth needs to be limited. If the cutoff frequency is not known, it is not known how wide the frequency band should be integrated.
 Figure 2
We all know that the spectrum diagram is a Bode diagram with the logarithm of the frequency as the x-axis. On a Bode plot, the bandwidth on the right side of the same width is much larger than on the left side. From the perspective of total noise, the right side of the Bode plot may be more important than the left side.
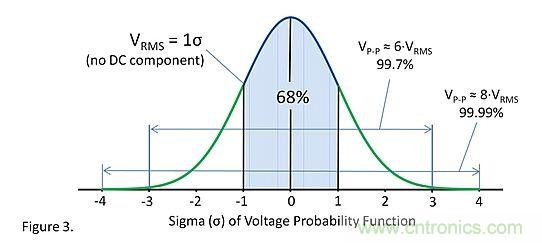
Resistor noise follows a Gaussian distribution, which is a probability density function that describes the distribution of amplitudes. It follows a Gaussian distribution because resistor noise is generated by a large number of small random events. The central limit theorem explains how it forms a Gaussian distribution. The rms voltage amplitude of AC noise is equal to the amplitude of the Gaussian distribution distributed within the range of ±1σ. For a noise with an rms voltage of 1V, the probability that the instantaneous voltage is within the range of ±1V is 68% (±1σ). People often think that there is some connection between white noise and Gaussian distribution, but in fact they are not. For example, the noise of a filter resistor is not white noise but still follows a Gaussian distribution. Binary noise does not follow a Gaussian distribution, but it is white noise. Resistor noise is both white noise and Gaussian distribution.
 Figure 3
Pure theoretical researchers would think that Gaussian noise has no defined peak-to-peak value, but it is infinite. This is correct. The Gaussian distribution curve stretches infinitely on both sides, so any voltage peak is possible. In practice, it is rare for voltage spikes to exceed ±3 times the RMS voltage. Many people use 6 times the RMS voltage to approximate the peak-to-peak value. To leave enough margin, even 8 times the RMS voltage can be used to approximate the peak-to-peak value.
An interesting point is that the sum of the noise of two resistors in series is equal to the noise of the two resistors. Similarly, the sum of the noise of two resistors in parallel is equal to the noise of the two resistors in parallel. If this were not true, it would cause problems when connecting resistors in series or parallel. Fortunately, it is true.
A high-value resistor will not produce arcs and sparks due to its own noise voltage. The parasitic capacitance of a resistor is in parallel with the resistor, which will limit its bandwidth and terminal voltage. Similarly, you can imagine that a high noise voltage generated on an insulator will be shunted by its parasitic capacitance and the surrounding conductors.
Reference address:Detailed analysis and small test of resistor noise
Thevenin noise model of resistors consists of a noise voltage source and a pure resistor, as shown in Figure 1.
The noise voltage is proportional to the square root of the resistor value, bandwidth and temperature (Kelvin). We usually quantify the noise within each 1Hz bandwidth, that is, its spectral density. In theory, resistor noise is a kind of "white noise", that is, the noise size is equal within the bandwidth, and the noise within each same bandwidth is the same.
 Figure 1
 The total noise is equal to the square root of the sum of the squares of each noise. The unit of spectral density we often mention is V/ . For a 1Hz bandwidth, this value is equal to the noise size. For white noise, the spectral density is multiplied by the square root of the bandwidth to calculate the size of the total white noise within the bandwidth. In order to measure and quantify the total noise, the bandwidth needs to be limited. If the cutoff frequency is not known, it is not known how wide the frequency band should be integrated.
 Figure 2
 We all know that the spectrum diagram is a Bode diagram with the logarithm of the frequency as the x-axis. On a Bode plot, the bandwidth on the right side of the same width is much larger than on the left side. From the perspective of total noise, the right side of the Bode plot may be more important than the left side.
Resistor noise follows a Gaussian distribution, which is a probability density function that describes the distribution of amplitudes. It follows a Gaussian distribution because resistor noise is generated by a large number of small random events. The central limit theorem explains how it forms a Gaussian distribution. The rms voltage amplitude of AC noise is equal to the amplitude of the Gaussian distribution distributed within the range of ±1σ. For a noise with an rms voltage of 1V, the probability that the instantaneous voltage is within the range of ±1V is 68% (±1σ). People often think that there is some connection between white noise and Gaussian distribution, but in fact they are not. For example, the noise of a filter resistor is not white noise but still follows a Gaussian distribution. Binary noise does not follow a Gaussian distribution, but it is white noise. Resistor noise is both white noise and Gaussian distribution.
 Figure 3
 Pure theoretical researchers would think that Gaussian noise has no defined peak-to-peak value, but it is infinite. This is correct. The Gaussian distribution curve stretches infinitely on both sides, so any voltage peak is possible. In practice, it is rare for voltage spikes to exceed ±3 times the RMS voltage. Many people use 6 times the RMS voltage to approximate the peak-to-peak value. To leave enough margin, even 8 times the RMS voltage can be used to approximate the peak-to-peak value.
An interesting point is that the sum of the noise of two resistors in series is equal to the noise of the two resistors. Similarly, the sum of the noise of two resistors in parallel is equal to the noise of the two resistors in parallel. If this were not true, it would cause problems when connecting resistors in series or parallel. Fortunately, it is true.
A high-value resistor will not produce arcs and sparks due to its own noise voltage. The parasitic capacitance of a resistor is in parallel with the resistor, which will limit its bandwidth and terminal voltage. Similarly, you can imagine that a high noise voltage generated on an insulator will be shunted by its parasitic capacitance and the surrounding conductors.
Previous article:Technical analysis: Detailed explanation of signal management system for functional testing
Next article:Veteran tips: How to quickly and accurately detect and repair high-voltage capacitors?
Recommended Content
Latest Test Measurement Articles
- From probes to power supplies, Tektronix is leading the way in comprehensive innovation in power electronics testing
- Seizing the Opportunities in the Chinese Application Market: NI's Challenges and Answers
- Tektronix Launches Breakthrough Power Measurement Tools to Accelerate Innovation as Global Electrification Accelerates
- Not all oscilloscopes are created equal: Why ADCs and low noise floor matter
- Enable TekHSI high-speed interface function to accelerate the remote transmission of waveform data
- How to measure the quality of soft start thyristor
- How to use a multimeter to judge whether a soft starter is good or bad
- What are the advantages and disadvantages of non-contact temperature sensors?
- In what situations are non-contact temperature sensors widely used?
MoreSelected Circuit Diagrams
MorePopular Articles
- LED chemical incompatibility test to see which chemicals LEDs can be used with
- Application of ARM9 hardware coprocessor on WinCE embedded motherboard
- What are the key points for selecting rotor flowmeter?
- LM317 high power charger circuit
- A brief analysis of Embest's application and development of embedded medical devices
- Single-phase RC protection circuit
- stm32 PVD programmable voltage monitor
- Introduction and measurement of edge trigger and level trigger of 51 single chip microcomputer
- Improved design of Linux system software shell protection technology
- What to do if the ABB robot protection device stops
MoreDaily News
- Learn ARM development(15)
- Analysis of the application of several common contact parts in high-voltage connectors of new energy vehicles
- Wiring harness durability test and contact voltage drop test method
- From probes to power supplies, Tektronix is leading the way in comprehensive innovation in power electronics testing
- From probes to power supplies, Tektronix is leading the way in comprehensive innovation in power electronics testing
- Sn-doped CuO nanostructure-based ethanol gas sensor for real-time drunk driving detection in vehicles
- Design considerations for automotive battery wiring harness
- Do you know all the various motors commonly used in automotive electronics?
- What are the functions of the Internet of Vehicles? What are the uses and benefits of the Internet of Vehicles?
- Power Inverter - A critical safety system for electric vehicles
Guess you like
- Selection of current resistance of switching power supply MOS
- Qorvo frequently promotes 5G and releases chips to make headlines?
- 5G's new Ultra-high Bands
- Switching Power Supply Study Group
- Is the Tsinghua virtual student singing a real person AI face replacement? The R&D team responds again!
- Sand built on gold - Qorvo announces acquisition of Cavendish Kinetics
- Can multiple ADCs simultaneously acquiring a signal improve system performance?
- Study of TMS320F28335 ADC module
- About Industrial Control System Development
- How to control the servo with MSP430G2 LaunchPad

 Signal Integrity and Power Integrity Analysis (Eric Bogatin)


 京公网安备 11010802033920号