This white paper introduces common applications and types of radar systems, key elements and typical test parameters of radar systems, and three commonly used pulse measurement methods based on scattering parameters.
Radar Formula
Radar is the abbreviation of radio detection and ranging. Its basic principle is as follows: when electromagnetic waves propagate in a specific direction at a known power and frequency, they will be reflected when they encounter a target, that is, part of the electromagnetic wave signal is reflected back by the target, and the reflected electromagnetic wave signal can be measured by the receiving device. The power of the received signal (Pr) or the distance between the radar transmitter and the target (R) can be calculated by the following radar equation:
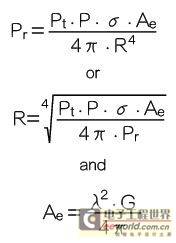
in:
Pr = received signal power;
R = distance between radar transmitter and target;
Pt = power of the transmitted signal;
G = radar antenna gain;
σ = radar cross section of the target;
Ae = effective antenna aperture;
λ = wavelength of the transmitted signal.
In addition to measuring distance, other information about the target can be measured by changing the radar system parameters, such as speed and direction. For example, scanning an area with a highly directional antenna can measure the azimuth and altitude of the target, and these two parameters can be used to determine the direction of the target, while the speed of the target can be determined by measuring the frequency shift of the received signal.
Radar classification based on purpose
Measuring the distance to a target is one of the basic functions of most radar systems. However, the technology of radar systems has improved significantly, including the manufacturing process, the signals used, the range of information obtained, and the use of the obtained information in various applications. Radar is widely used in military and civilian fields, and its specific uses include (Figure 1):
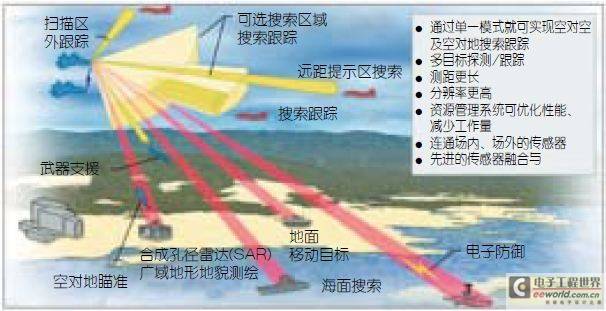
Figure 1: Radar has a wide range of uses (Courtesy of Raytheon).
· Surveillance (e.g. threat identification, moving object detection or proximity fuze generation);
· Detection and tracking (e.g. target identification and tracking or maritime rescue);
Navigation (e.g., automotive collision avoidance or air traffic control);
High-definition imaging (e.g. terrain mapping or landing navigation);
· Weather tracking (e.g. storm shelter or wind profile data acquisition).
Here are some common radar systems that use different types of signals (Figure 2):

Figure 2: Radar uses different signals depending on its application.
CW (Doppler) radar: This radar system transmits a continuous wave signal at a constant frequency. The received signal undergoes a Doppler shift , which can be used to determine the speed of the target. Police often use this radar system to monitor traffic conditions.
· FMCW radar: This radar system modulates the frequency of a CW signal to generate a timing reference. The user can determine the range and speed of a target from the timing reference. A significant advantage of CW-based radars (compared to pulsed radar systems) is that they provide continuous detection results. Aircraft are often equipped with this radar system to accurately measure altitude during landing. [page]
Pulse radar: This is a basic (non-coherent) pulse radar system that calculates the distance and direction of a target by measuring the time interval between the transmitted pulse and the received pulse. Since the phase between the pulses is random, pulse radar systems are non-coherent radar systems. This radar system is mostly used for long-range air surveillance.
Pulse Doppler radar: This is a coherent radar system that measures the range, direction, and velocity of a target based on the phase differences between received pulses. Pulse Doppler radar systems typically use a high pulse repetition rate (PRR), which allows for more accurate radial velocity measurements, but is less accurate when measuring range. This radar system is often used to detect moving targets while suppressing stationary clutter, and is very effective in weather monitoring applications.
Moving Target Indicator (MTI) radars: These radars also use Doppler frequency to distinguish the echoes of moving targets from stationary objects and clutter. The MTI radar waveform is a series of low PRR pulses, which can avoid range ambiguity, but cannot accurately estimate the speed of the target. These radars are commonly used for surface-to-air search and surveillance.
Pulse compression radar: Narrow pulse signals can achieve better range resolution, but the range is limited. Wide pulse signals contain more energy and can measure longer distances, but the resolution is poor. Pulse compression combines the power advantage of wide pulses with the resolution advantage of short pulses. By adjusting the frequency (e.g., linear frequency modulation) or phase (e.g., using Barker codes) of the transmitted signal, the wide pulse can be compressed at the receiver by the inverse of the adjusted signal width (Figure 3). Many weather monitoring systems already use pulse compression radar.

Figure 3: Pulse compression combines the power advantages of wide pulses with the resolution advantages of short pulses.
Elements of radar systems and their impact on system performance
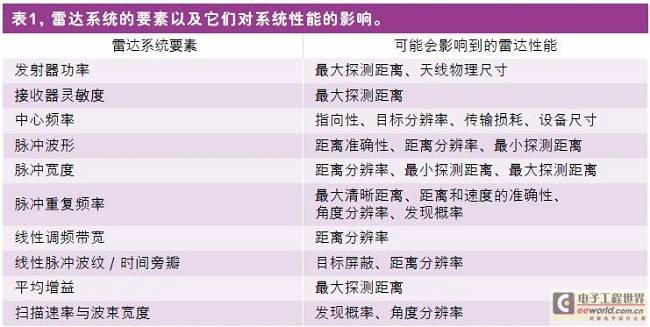
When introducing radar equations, signal types, and antenna configurations, we mentioned many elements in a radar system. Table 1 summarizes some of the elements of a radar system and their impact on system performance.
Testing radar
Given the role they play, radar systems must operate as intended, or there could be serious consequences. Therefore, radar systems must be rigorously tested. Verifying the performance of the RF chain (Figure 5) is an important part of radar testing. Testing can be done on subsystems (such as the transceiver components of an active phased array radar) or specific components in the RF chain (such as the power amplifier of a transmitter or the low-noise amplifier of a receiver).
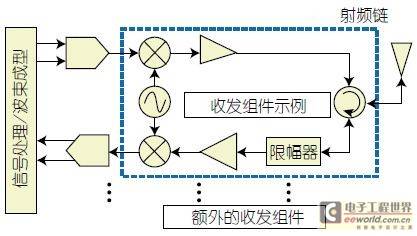
Figure 5: Simplified block diagram of an active phased array radar system.
The measurements included in a typical test are as follows:
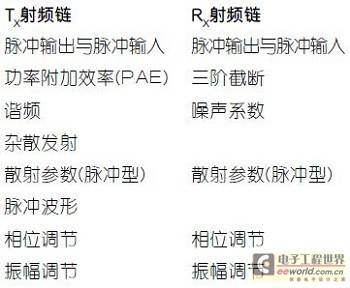
Pulse measurement type
There are many common types of scattering parameter based and pulse shaping measurement techniques used in radar applications. This section discusses three of the most common measurement methods.
In-pulse point measurement
Intra-pulse point measurements quantify the scattering parameter data at any point in time within the pulse. These measurements use frequency or power sweep techniques and are plotted on demand after the measurement. This measurement method is useful when it is necessary to avoid possible pulse edge effects. For example, amplifiers are often stabilized at the beginning of a pulse. [page]
For point-in-pulse measurements, a long measurement period is required to obtain data, and the user needs to specify the corresponding interval for the synchronization pulse, namely T0 (Figure 6). This time interval is generally quantified by the delay (T1) and the required measurement time window width. By adjusting the delay (T1) of the measurement time window start time, initial effects such as amplifier settling time can be avoided. The following equation can be used to determine the minimum measurement time window:
TMW≥1/IFBW

Figure 6: Intra-pulse point-in-time measurements quantify the scattering parameter data at any point in time within the pulse.
If you use Anritsu (Anritsu) MS4640B vector network analyzer options 035 and 042 (PulseView), its 200MHz intermediate frequency bandwidth (IFBW) can form a minimum measurement time window (TMW) of 5ns.
If additional dynamic range is required, an average level can be specified for this purpose, so that the same time interval is analyzed over multiple pulses, the results are sampled from the same coherent clock, and the phase information is maintained.
This measurement method is suitable when the internal structure of the pulse and the differences between pulses do not need to be analyzed, but only the pulses need to be measured as a whole.
Pulse shaping measurements
Pulse shaping measurements focus on the data structure within the pulse (Figure 7). Pulse shaping measurements are performed in the time domain while the frequency and power are held constant. This measurement method is often used to determine pulse characteristics such as overshoot/undershoot, waveform droop, and edge response (e.g., rise/fall times).
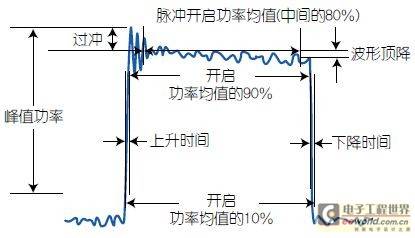
Figure 7: Pulse shaping measurements focus on data structures within the pulse, such as overshoot/undershoot, waveform droop, and edge response.
To characterize the shaped pulse, the start time (Tstart), the end time (Tstop) and multiple time points relative to the synchronization pulse, T0, are set (Figure 8). If necessary, the measurement can start before the physical pulse and end after the DUT during the difference between UT and UTC. The measurement time window width is specified and it is also possible to average over multiple pulses. For point-in-pulse measurements, a wide range of measurement time window widths is allowed.

Figure 8: To specify the characteristics of a shaped pulse, it is necessary to set the start time, end time, and multiple time points relative to the synchronization pulse.
In pulse shaping measurements, the differences between pulses are often not noticeable, so the measurement may be an average of multiple pulses. However, the measurement can be designed to observe the behavior of the pulse from an absolute start time without averaging, thereby observing the entire evolution of the pulse behavior. Once the measurement data is obtained, it is usually plotted against time, so more complex measurements can be made using multiple channels or setups.
Pulse to Pulse Measurement
Pulse-to-pulse measurement is the process of quantifying the differences between pulses within a pulse stream. This measurement is also made in the time domain, where frequency and power are held constant. This measurement is often used to determine if pulse characteristics are changing over time. For example, a high power amplifier may experience thermal effects that can cause gain differences or phase differences.
Figure 9 shows a pulse-to-pulse measurement of three pulses. During the measurement, the corresponding delay (T1) is set by the synchronization pulse (T0) and each pulse is processed individually.
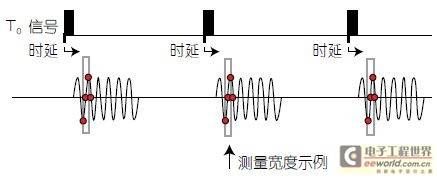
Figure 9: Pulse-to-pulse measurement is the process of quantifying the differences between pulses within a pulse stream to understand the thermal effects of high-power amplifiers.
In the measurement methods mentioned above, the available measurement time window width and pulse width range are wide, as long as the maximum width recorded is not exceeded. Among them, the maximum measurement time window width recorded on the MS4640B vector network analyzer is 0.5s. Therefore, even wider or lower repetition rate pulses can be measured. In addition, people can use multiple channels or settings to measure by cycling through various frequencies/powers.
Summarize
Modern radar systems require increasingly accurate measurements. Modern test solutions must eliminate and overcome the trade-offs and limitations commonly seen in pulse measurements. The Anritsu MS4640B vector network analyzer uses a high-speed digitizer architecture that delivers the highest resolution and timing accuracy in the industry. For more information on eliminating trade-offs in pulse measurement testing, see Anritsu white paper (11410-00709) - Eliminating and Overcoming Trade-Offs and Limitations in Pulse Measurement Test Solutions. For more information on the high-speed architecture of the MS4640B, see Anritsu white paper (11410-00711A) - VNA High-Speed Architecture Improves Timing Resolution and Accuracy for Radar Pulse Measurements.
The VectorStar series is Anritsu's high-end vector network analyzer series that provides the best overall performance on contemporary work platforms. Among them, the MS4640B series has the strongest performance and can provide a frequency coverage range of 70kHz~70GHz. For broadband applications, the ME7838A series can provide ultra-wide frequency coverage of 70kHz~110GHz for a single 1mm coaxial test port. For multi-port applications, the MN469xB series supports 4-port measurements. In addition, the VectorStar system that supports 12-port measurements can cover a maximum frequency of 70GHz. The SM6430 VectorStar nonlinear system is the most complete high-performance nonlinear analysis system that can be flexibly upgraded through multiple paths.
The Anritsu MS4640B vector network analyzer provides enhanced performance, which helps device modeling engineers achieve accurate and reliable device modeling; helps R&D engineers maximize the dynamic range of their product designs and develop state-of-the-art equipment; and helps manufacturing engineers maximize production efficiency while ensuring accuracy.
The Anritsu MS4640B vector network analyzer provides the widest frequency coverage from 70kHz to 70GHz in a single instrument. Covering frequencies up to 70GHz is impressive, but the extra twenty octaves of frequency at the low end is even more exciting because it allows for better component modeling without an RF network analyzer. The MS4640B vector network analyzer not only has excellent raw performance, but also has an industry-leading 100dB dynamic range at 70GHz, so the instrument can complete the most difficult measurements in the most stable and accurate way.
When using the instrument to perform comprehensive sweeps at the industry's fastest speed (20 microseconds/point), its sensitivity can reach 80dB. In addition, this vector network analyzer's measurement results are the most accurate and comprehensive compared to similar products on the market, both now and for a long time to come.
Anritsu vector network analyzer is designed to be the ideal microwave vector network analysis platform. It is based on the open Windows architecture, can be connected to a variety of devices, has an intuitive interface, and has unlimited potential, such as supporting 100,001 measurement points in single channel mode. Not only that, it also provides the industry's first standard 3-year warranty service, coupled with a responsive sales and technical support team, the MS4640B is the most sensible choice for engineers.
The Anritsu MS4640B vector network analyzer with options 035 and 042 (PulseView) has the ability to generate and measure pulse signals. The instrument's four internal signal generators can generate singlet, doublet, triplet, quadruple/burst pulse signals. The Anritsu MS4640B vector network analyzer supports a variety of pulse measurement methods, such as pulse shaping measurement, fixed-point measurement within a pulse, and pulse-to-pulse measurement.
Previous article:1xEV-DO Mobile Terminal Test Requirements and Methods
Next article:Factors to consider during NFC device production testing
- Popular Resources
- Popular amplifiers
- Seizing the Opportunities in the Chinese Application Market: NI's Challenges and Answers
- Tektronix Launches Breakthrough Power Measurement Tools to Accelerate Innovation as Global Electrification Accelerates
- Not all oscilloscopes are created equal: Why ADCs and low noise floor matter
- Enable TekHSI high-speed interface function to accelerate the remote transmission of waveform data
- How to measure the quality of soft start thyristor
- How to use a multimeter to judge whether a soft starter is good or bad
- What are the advantages and disadvantages of non-contact temperature sensors?
- In what situations are non-contact temperature sensors widely used?
- How non-contact temperature sensors measure internal temperature
- LED chemical incompatibility test to see which chemicals LEDs can be used with
- Application of ARM9 hardware coprocessor on WinCE embedded motherboard
- What are the key points for selecting rotor flowmeter?
- LM317 high power charger circuit
- A brief analysis of Embest's application and development of embedded medical devices
- Single-phase RC protection circuit
- stm32 PVD programmable voltage monitor
- Introduction and measurement of edge trigger and level trigger of 51 single chip microcomputer
- Improved design of Linux system software shell protection technology
- What to do if the ABB robot protection device stops
- Sn-doped CuO nanostructure-based ethanol gas sensor for real-time drunk driving detection in vehicles
- Design considerations for automotive battery wiring harness
- Do you know all the various motors commonly used in automotive electronics?
- What are the functions of the Internet of Vehicles? What are the uses and benefits of the Internet of Vehicles?
- Power Inverter - A critical safety system for electric vehicles
- Analysis of the information security mechanism of AUTOSAR, the automotive embedded software framework
- Brief Analysis of Automotive Ethernet Test Content and Test Methods
- How haptic technology can enhance driving safety
- Let’s talk about the “Three Musketeers” of radar in autonomous driving
- Why software-defined vehicles transform cars from tools into living spaces
- Reasons why the POE module does not supply power
- What are the types of LDOs used in portable mobile devices? Ripple test methods
- RglComm is an open source USB control software for Rigol devices
- KEIL compile error No such file or directory
- Newbie help! What do footprint and LibRef mean?
- Solution to the error after importing CCS3.3 project into CCS6.2
- Freescale's MC9S12XET256 chip, please help me with the problem of multiplexing function mapping
- Extreme point test
- Urgently looking for VL6180X Chinese version manual
- Urgent help!!! About the calculation of the inductance of the switching power supply transformer

 TL074IBID


 京公网安备 11010802033920号