In this paper, the theory and implementation method of space electromagnetic signal spectrum analysis are proposed for the electromagnetic environment of the actual battlefield, and the relationship between signal sampling, signal time domain and frequency domain is explained. Simulation experiments are carried out on the methods involved in this paper to verify the correctness and effectiveness of the proposed methods. The spectrum analysis of space electromagnetic signals and its implementation method proposed in this paper provide an analysis and experimental method close to the actual electromagnetic environment for the offensive and defensive sides of electronic warfare to conduct confrontation implementation and confrontation effectiveness evaluation.
1 Time-frequency relationship of signal
1.1 Sampling theorem
Assume that the frequency range of the signal is [fL, fH]. According to the Nyquist sampling theorem, the sampling frequency must be greater than 2 times the highest frequency of the signal to ensure that the signal does not alias in the frequency domain. However, since radar signals often transmit signals with very high center frequencies, such as 10 GHz, and the bandwidth of the transmitted signal is generally in the MHz range, if the sampling is 2 to 3 times the center frequency according to the Nyquist low-pass sampling theorem, it will cause a great burden on the system.
For this reason, the bandpass sampling theorem is adopted. Assume that the bandpass signal can accommodate m frequency shifts within the range of [-fL, fH] without generating spectrum aliasing.

1.2 Spectral characteristics after bandpass sampling
Assume that the center frequency of the signal is fc; the bandwidth is B. Figure 1 is the spectrum graph using the low-pass and bandpass sampling theorems respectively.
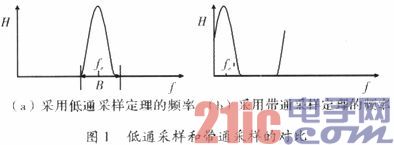
Experiments have found that after the bandpass sampling theorem is adopted, the spectrum is shifted, and the center frequency is no longer fc on the spectrum diagram, but other values, but the spectrum shape and bandwidth remain unchanged.
The relationship between the frequency after bandpass sampling and the frequency of the original signal is

: where f is the original frequency; fl is the corresponding frequency on the spectrum diagram after bandpass sampling;
((n))N represents n modulo N.
1.3 Relationship between signal amplitude and power
Suppose the time domain form of the signal is x(t); the signal duration is τ, and the signal is sampled at fs to obtain a discrete signal of N points. Then the relationship between time, sampling frequency and number of points is
τ=N/fs (4)
Perform point FFT on the discrete signal x(n), that is, obtain the spectrum of the signal. Suppose the spectral line value at each point is H(n). Since the value on each spectral line of FFT is the superposition of N points of Fourier transformation, the spectrum after FFT transformation needs to be normalized, so the power of the signal is 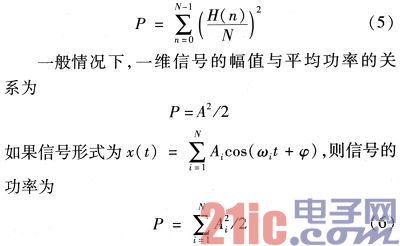
If it is a two-dimensional signal, since the signal has real and imaginary parts, the relationship between amplitude and average power is P=A2
[page]
2 Time Domain Form and Power of Space Electromagnetic Signals
2.1 Power of Electromagnetic Signals in Free Space
Electromagnetic signals in space are complex and diverse. Taking the radar that most often appears in space combat as an example, the electromagnetic signals in free space are calculated. According to the radar equation, the power of the radar signal at a receiving point in space is where
![]()
Pt and Gt represent the radar's transmitting power and transmitting antenna gain respectively; σ represents the cross-sectional area at the receiving point in space; R represents the distance between the radar and the target point; Lr represents the total system loss of the radar. Where σ=, so the power is where
![]()
Gr is the receiving antenna gain at the receiving point; λ is the wavelength of the transmitted signal.
2.2 Time Domain Form of Electromagnetic Signals
Assume that there are multiple radars in space, where the position vector of each radar is Lri, and the transmitted signal is sr(i, t), where i represents the serial number of the radar, and i=1,…,M.
According to the relationship between signal amplitude and power, the amplitude of the i-th radar transmitter reaching the test point is where 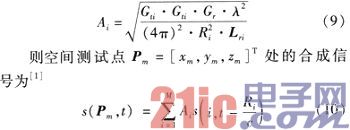
Ri represents the distance between the i-th radar transmitter and the test point Pm; c represents the speed of light; and Ri/c represents the transmission delay between the observation point and each transmitter.
2.3 Power of electromagnetic signal
Perform N-point FFT on the time domain signal s(Pm, t) to obtain the spectrum of the electromagnetic signal. The spectrum is calculated for the receiving frequency band according to formula (5) to obtain the signal power received at the receiving point.
However, this spectrum is the spectrum after being moved according to formula (5), and the spectrum needs to be restored. In the process of restoration, it is found that it is easier to calculate the power by moving the receiving frequency band, so the following method is used for calculation:
(1) Move the receiving frequency f and calculate the frequency fl of the receiving frequency in the spectrum.
(2) Calculate the spectral line position of fl in the spectrum ![]() and read the spectral line value at this point in the spectrum.
and read the spectral line value at this point in the spectrum.
(3) Multiply the spectral line value by the filter coefficient, normalize it and take the square.
(4) Traverse the receiving frequency band and add the values in formula (3) to obtain the receiving power.
3 Spectrum analysis of electromagnetic signals
To verify the correctness of the proposed algorithm model and implementation method, VC software was used for software programming and simulation experiments, and Matlab was used to display the calculated results. Taking
radar as an example, the radar information is as follows:
radar position: longitude and latitude (119.5°, 19.5°, 100 m); azimuth scanning range (0°, 180°); elevation scanning range (30°, 90°); transmission center frequency 2.5 GHz; bandwidth 10 MHz; transmission power 50 kW; signal simulation duration 5 μs; transmission waveform: linear frequency modulation signal; set the receiving center frequency at the receiving end to 2.5 GHz; bandwidth 10 MHz.
Through system simulation calculation, the sampling frequency fs=20040 080.32 and the number of sampling points N=1 024 are obtained. The
calculated spectrum information is written into a file, and the waveform obtained by drawing with Matlab is shown in Figures 2 and 3.
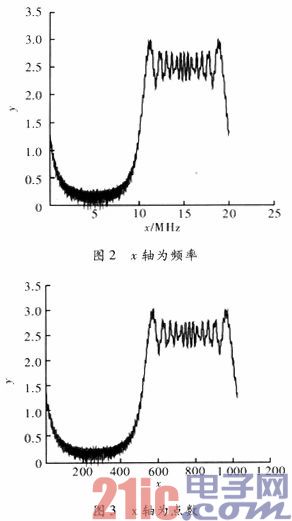
By using formula (3), the center frequency is shifted to obtain ((fc))fs=((2 500 000 000))20040 080.32=15 030 080, which is consistent with the center frequency in Figure 1.
[page]
By calculating step (2) in Section 2.3, we get the point position m = ![]() , which is consistent with the center frequency point position in Figure 2.
, which is consistent with the center frequency point position in Figure 2.
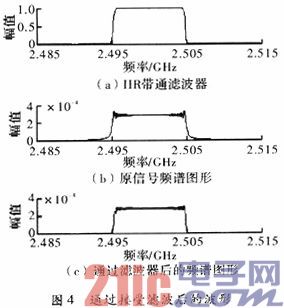
Pass the spectrum through the filter and shift the spectrum of the filter according to formula (3), and we get the result shown in Figure 4. It can be seen that the test result is consistent with the input.
Taking radar information as an example, the method in this paper is used to calculate the electromagnetic intensity of a region in space and test the results.
Assume that the region is in the longitude range (119-120), the latitude range (19-20), and the altitude is 10000 m.
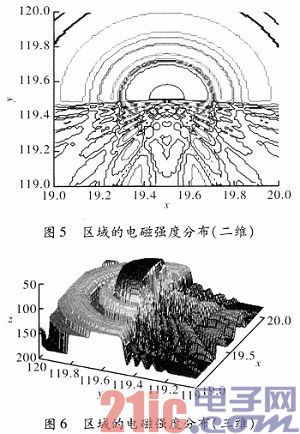
The simulation results are shown in Figures 5 and 6. It can be seen that the azimuth scanning range is (0-180), which matches the input azimuth information, and the spatial intensity of the area covered by the main lobe of the radar antenna is significantly larger, and the lobe is obvious. This verifies the correctness of signal generation and spectrum analysis.
4 Conclusion
For electromagnetic signals in space, their generation and spectrum analysis, as well as the sampling frequency, number of sampling points, spectrum shifting, and the relationship between power and spectrum are explained, and the correctness of the proposed method is verified through simulation. This helps to understand the complex electromagnetic environment and intensity analysis in space.
Previous article:NI Platform Accelerates WLAN Testing
Next article:LitePoint Launches Wi-Fi Production Test Solution
- Popular Resources
- Popular amplifiers
- From probes to power supplies, Tektronix is leading the way in comprehensive innovation in power electronics testing
- Seizing the Opportunities in the Chinese Application Market: NI's Challenges and Answers
- Tektronix Launches Breakthrough Power Measurement Tools to Accelerate Innovation as Global Electrification Accelerates
- Not all oscilloscopes are created equal: Why ADCs and low noise floor matter
- Enable TekHSI high-speed interface function to accelerate the remote transmission of waveform data
- How to measure the quality of soft start thyristor
- How to use a multimeter to judge whether a soft starter is good or bad
- What are the advantages and disadvantages of non-contact temperature sensors?
- In what situations are non-contact temperature sensors widely used?
- LED chemical incompatibility test to see which chemicals LEDs can be used with
- Application of ARM9 hardware coprocessor on WinCE embedded motherboard
- What are the key points for selecting rotor flowmeter?
- LM317 high power charger circuit
- A brief analysis of Embest's application and development of embedded medical devices
- Single-phase RC protection circuit
- stm32 PVD programmable voltage monitor
- Introduction and measurement of edge trigger and level trigger of 51 single chip microcomputer
- Improved design of Linux system software shell protection technology
- What to do if the ABB robot protection device stops
- Analysis of the application of several common contact parts in high-voltage connectors of new energy vehicles
- Wiring harness durability test and contact voltage drop test method
- From probes to power supplies, Tektronix is leading the way in comprehensive innovation in power electronics testing
- From probes to power supplies, Tektronix is leading the way in comprehensive innovation in power electronics testing
- Sn-doped CuO nanostructure-based ethanol gas sensor for real-time drunk driving detection in vehicles
- Design considerations for automotive battery wiring harness
- Do you know all the various motors commonly used in automotive electronics?
- What are the functions of the Internet of Vehicles? What are the uses and benefits of the Internet of Vehicles?
- Power Inverter - A critical safety system for electric vehicles
- Analysis of the information security mechanism of AUTOSAR, the automotive embedded software framework
- TMS320F28027F for power stage control
- Can anyone who knows about TSIP give me some advice?
- If anyone has photos of bulging lithium polymer batteries, please post them here.
- Adjust the brightness of the LED provided by Zigbee
- FPGA Design Flow
- Qorvo Launches First Smart Home Device Controller to Enable Simultaneous Wireless Communications
- [nRF52840 DK Review] +52840 NFC (Part 1)
- [Grab the post with prizes] Let’s talk about how you spent the Children’s Day that left the deepest impression on you?
- [TI recommended course] #DC/DC switching regulator packaging innovation#
- Which two pins’ parameters do the charge delay time, rise time and capacitance of MOS tube refer to?

 LT1077IJ8


 京公网安备 11010802033920号