Building an open source dynamic light scattering device
Source: InternetPublisher:fish001 Keywords: detector open source light detector Updated: 2024/12/19
Let's build an affordable, open-source dynamic light scattering device for nanoparticle size measurement!
Characterizing the size of micro- and nanoparticles is important in many applications, such as protein aggregation and complex fluid studies. For particles larger than about one micron, optical microscopy can be used in combination with image analysis software. However, for submicron particles, more advanced and expensive techniques must be employed, such as electron microscopy or light scattering. In particular, dynamic light scattering (DLS) is widely used for dilute particle suspensions. In DLS, the particle size is calculated in reverse from the way the light scattered from a laser beam evolves over time as the particles undergo Brownian motion in a fluid. Typical commercial DLS equipment is expensive because of the high-quality lasers and detectors used, which can measure over a wide range of particle sizes and concentrations. Some recent equipment can even determine the shape of non-spherical particles.
This project aims to explore the principles and boundaries of DLS with low-cost components and open-source designs, compared to expensive commercial equipment. More broadly, we hope that this approach will also be helpful for future projects involving light scattering or high-frequency data recording.
introduce
Dynamic light scattering works as follows (see figure below): A laser beam is shone onto the sample and is scattered in all directions by the particles (assuming the particle size is smaller than the laser wavelength). The scattered light is collected from the beam at a specific angle (here 90°). Photons from different particles interfere with the detector to produce a specific intensity. Since the particles in the solution undergo Brownian motion, the collected intensity varies with time, and the magnitude can then be deconvoluted from the intensity time series.

Light collected at large angles from a clear solution is very dim, so modern DLS devices use expensive components, such as high-intensity lasers and single-photon detectors, to improve their signal-to-noise ratio and enable accurate measurements within minutes. This is critical for the smallest particles (a few nanometers) which tend to scatter less light. In addition, small particles move faster in solution, requiring high-frequency signal sampling (up to 100 kHz). The aim of this project is to explore the technological boundaries of DLS technology with accessible components, at the expense of longer measurement times, limited accuracy and reduced particle size range.
What is measured
Well-characterized high molecular weight proteins (spectrin) and fibers (cellulose) in solution will be investigated first. Then other types of colloidal systems, such as milk and milk substitutes, will be investigated.
Hardware Design Goals
Safety - The enclosure completely encloses the system. If the enclosure is accidentally opened, the laser will shut down.
Usability - Easy to measure samples.
Cost - Affordable components and 3D printed enclosures.
Portability - The device will be built around an Arduino board connected to a PC via a USB port, sending intensity time series. The software will be written in Python.
Project Implementation
Housing and Assembly
The following diagram shows the components of the device. You may need to adjust some of the components depending on your hardware.
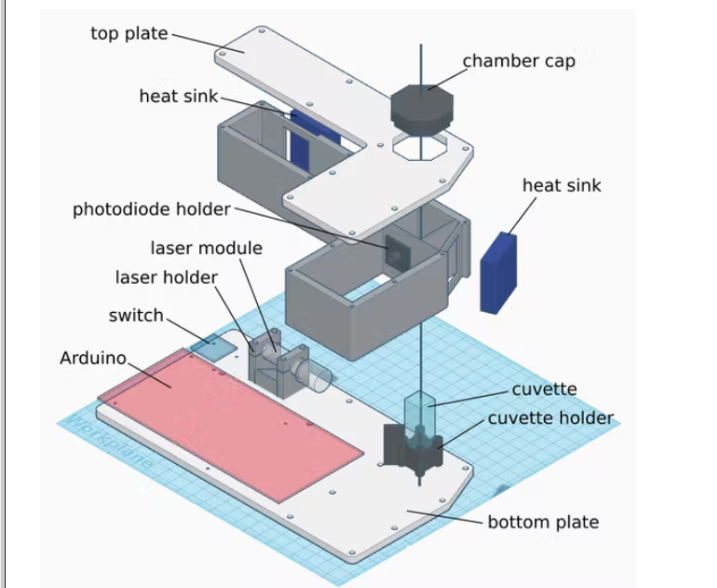
The top and bottom plates were laser cut from opaque sheets. We used white PMMA in the cuvette chamber and sprayed it with black matte paint. Cutting directly from the dark matte material should be a better choice. The other parts were 3D printed from black PLA. The heat sinks were fixed with double-sided tape. One heat sink is used as a beam stop and is in an inclined position to direct the unabsorbed beam out of the cuvette chamber. The other heat sink is placed next to the laser module, where the efficiency is relatively low.
Laser and Safety

CAUTION: Direct viewing of the laser diode emission may result in eye damage. Extreme care must be taken to prevent viewing the beam, either directly or by reflection. Wear protective eyewear appropriate for the wavelength. If there are other people in the same room, they should also wear protective gear.
The project uses a Thorlabs 650nm 4.5mW laser module CPS650F, although there may be cheaper alternatives. But the main reason I used it is that it has an advantage of having an integrated current driver and a focusing optic. We only need to provide 5V, and since the maximum current is 60mA, we can use the Vcc (or 5V) port of the Arduino.
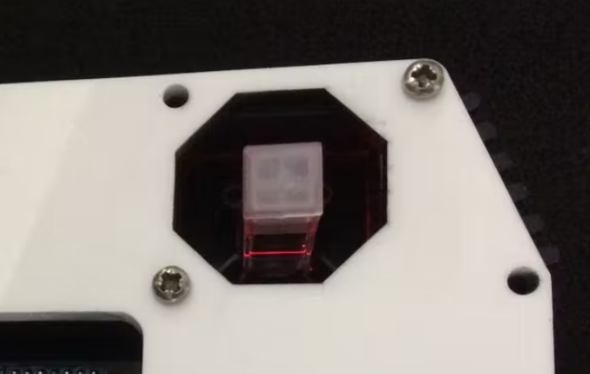
In normal mode, the device should be run with the laser housing intact (like a CD player). To align and focus the laser, we used Thorlabs' LG4 glasses and a piece of white paper. The laser is aligned with the screws of the loose laser holder. The hole in the post mount is large enough to allow some flexibility. The beam should be focused in the center of the cuvette.
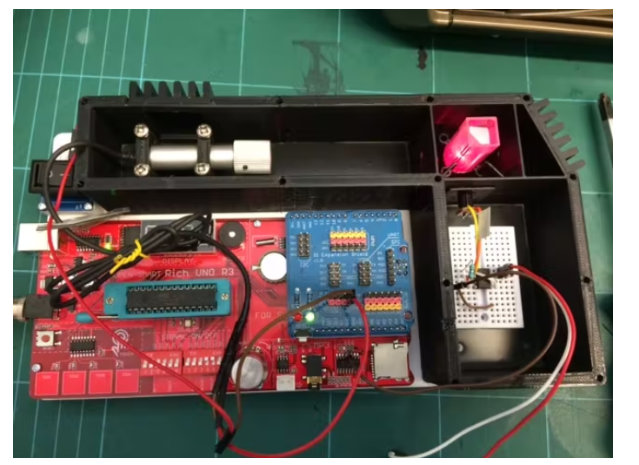
In the image below, the beam is visible in slightly turbid water.
Light Detector
This part was probably the most challenging part of the project.
Option 1 - Photoresistor
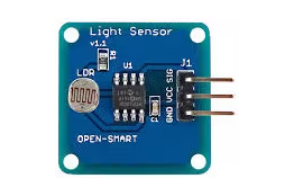
The Biomaker Challenge Pack comes with a breakout board light sensor from Open-Smart. We tested it and although it responds amazingly fast (up to 20 kHz), it's sensitivity is a bit low at two.
Option 2 - Grove Digital Light Sensor
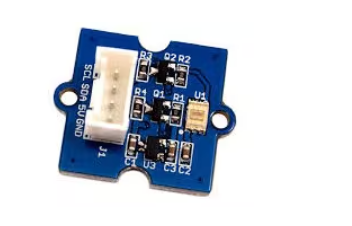
Another light sensor compatible with Arduino. It comes with an integrated ADC, but we found that the sampling rate is limited in the library code. It is not clear why, and we decided to go with the next option:
Option 3 - Photodiode with custom circuit
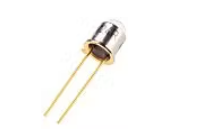
A photodiode generates a small current when it receives light. The following transimpedance circuit is used to convert this current into a (mostly) amplified voltage signal readable by the Arduino:
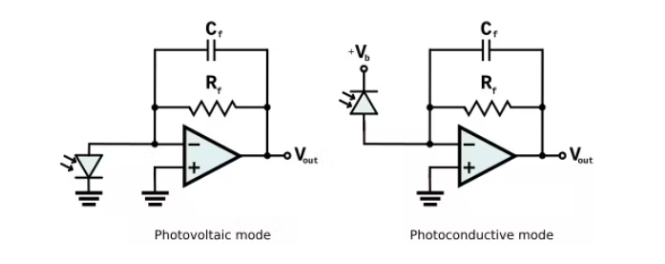
In photovoltaic mode (left), the diode has no bias voltage applied. Biasing is used to reduce the capacitance of the diode, thereby increasing bandwidth (right). Gain is controlled by the feedback resistor Rf. Larger Rf means larger gain, but very large resistors tend to have non-negligible inherent capacitance. Capacitor Cf is used to stabilize the op amp, but reduces bandwidth.
composition:
Photodiode: BPW24R;
Operational amplifier: TLC082IP
In photovoltaic mode, Rf = 1 to 10 MOhm, Cf = None. We cannot operate a photodiode in bias mode.
To test the detector, we placed an LED in front of it (no need to use a laser at this stage) with a diffuser to avoid saturating the photodiode. A function generator drives the LED with a square wave signal of a specified frequency, and the output voltage of the detector is sampled by an Arduino.
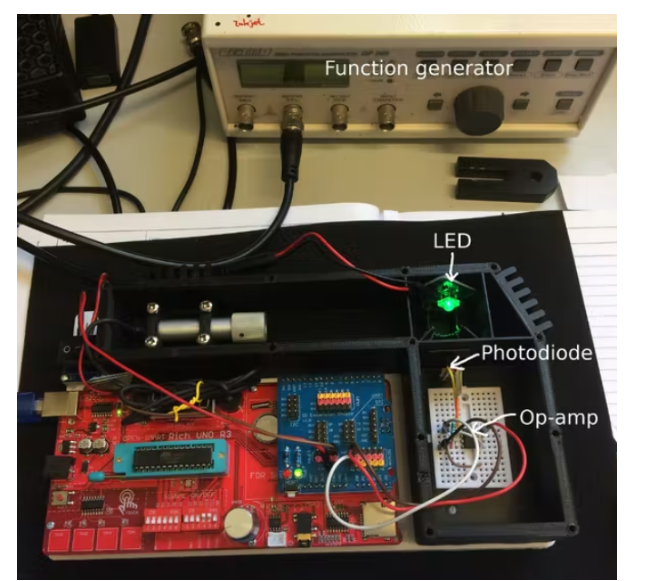
We use a time step of 15 microseconds (67 kHz sampling). In theory, we could sample a 33 kHz signal, but with a 5 kHz signal we get more points per cycle. The first observation is that the capacitance of the 5 MOhm Rf resistor is too large, as we can see:
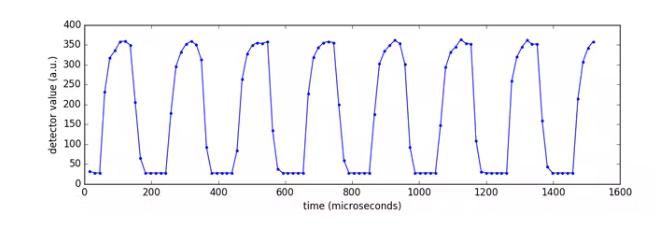
Using a 1 MOhm Rf resistor we get a weaker but sharper square wave:
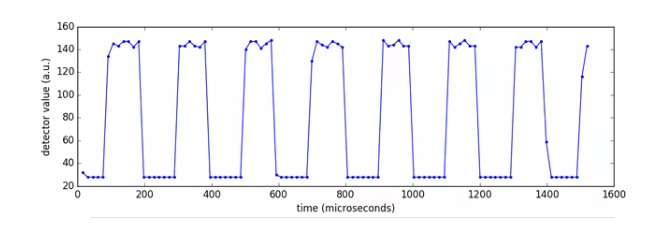
So we choose Rf = 1 MOhm, and since our op amp has two channels, we use the second channel to amplify further. The second channel is preceded by a high pass filter to remove the offset from the first channel. A better system would use an op amp with a zero offset function, with a logarithmic potentiometer used to adjust the gain of the second stage. A low pass filter is then used to suppress the high frequencies that the ADC cannot handle.
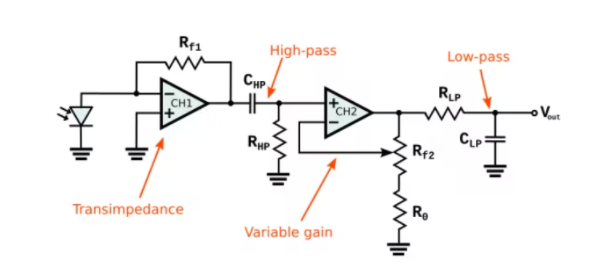
Rf1 = 1 MOhm, CHP = 220 nF, RHP = 47 kOms, Rf2 = 0-50 kOhm, R0 = 10 Ohm, RLP = 100 Ohm, CLP=47nF,
If we put a stronger diffuser in front of the LED, we won't get anything from the first channel, but we will get a somewhat distorted signal from the second channel:
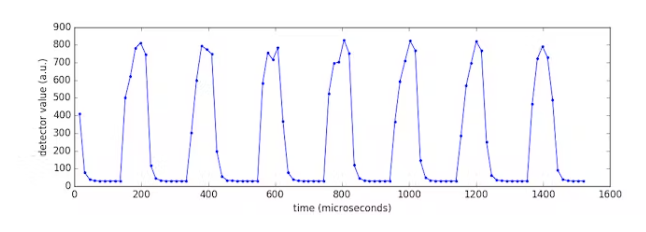
Being able to adjust the gain is also important because various solution samples will scatter light at different amplitudes.
The last missing piece is the detector's optics. Currently it collects light from a fairly wide angle (12°), but it's not clear if that has a significant effect on the system.
Sampling data from the detector
We will try to sample the photodiode signal at about 67 kHz using only Arduino functions. By default, the Arduino Uno can sample at around 10kHz, without taking into account the overhead caused by serial communication. So it will take some work to speed it up. Fortunately, there are many examples online. This thorough document by Willem Maes can help: magelhaes.hzs.be/willem/Arduino/speeding.pdf . We can act on three levels:
First, the ADC (Analog to Digital Converter) clock is by default set to a much lower speed than the ATmega. We can change the clock speed in the code.
Second, the ADC can be used in a free-running mode, in which the ADC continuously converts the input, saving function call overhead.
Third, before calling the serial communication transmitter, the values are stored in a buffer (here 800 values of 16 bits). The size of the buffer is limited by the available memory on the chip. Here 800 values can be sampled at 67kHz for 12ms.
Points 1 and 3 are now in place. The following figure shows a 20 kHz square wave generated by a function generator and sampled by the Arduino via pin A0, with analogRead running at a time step of 8.5 microseconds (117 kHz).

const unsigned int numReadings = 800;
unsigned int analogVals[numReadings];
long t, t0;
Then we change the ADC clock speed. We also set up the serial port:
#ifndef cbi
#define cbi(sfr, bit) (_SFR_BYTE(sfr) &= ~_BV(bit))
#endif
#ifndef sbi
#define sbi(sfr, bit) (_SFR_BYTE(sfr) |= _BV(bit))
# endif
void setup() {
Serial.begin(115200);
// set prescale to 16
sbi(ADCSRA, ADPS2) ; // cbi means clear bit
cbi(ADCSRA, ADPS1) ; // sbi means set bit
cbi(ADCSRA, ADPS0) ;
}
The main loop starts by collecting 800 points and then sends the table analogVals to the computer, ending with the total duration (t) of the time series.
void loop() {
t0 = micros();
for (int i=0; i < numReadings ; i++)
{
analogVals[i] = analogRead(A0);
}
t = micros()-t0; // calculate elapsed time
/ / Send to computer
for (int i=0; i < numReadings ; i++)
{
Serial.print(analogVals[i]);
Serial.print(',');
}
Serial.println(t);
delay(10);
}
Analyzing the data
We use Python with some libraries installed (serial, numpy, matplotlib and scipy). To use the script, open it with a text editor and check the definition of the variables (especially the Arduino addresses and everything related to your experimental conditions).
address='/dev/ttyUSB0' # Arduino address
baud=115200 # baud for serial communication
lambd = 650e-9 # [m] Laser wavelength
n_s = 1.33 # Solvent refractive index at wavelength
k = 1.380649e-23 # [j/k ] Boltzmann constant
T = 293 # [K] Temperature
eta_s = 0.001 # [Pa.s] Solvent viscosity measurement at T
theta = np.pi/2 # Scattering angle
Then launch in a terminal, followed by the number of time series to get from the device (default is one):
python2 OpenDLS.py 1
Let's look at our first signal. After applying gain we get a noisy curve, but with a lot of variation in the low frequencies:
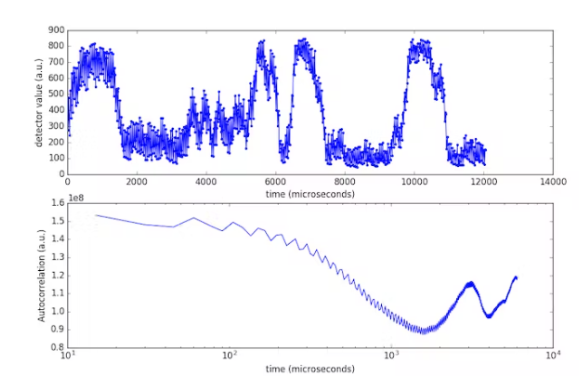
At this stage it is not clear whether the peak is due to dust particles reflecting the beam. Furthermore, the autocorrelation function has an interesting tail: this is because the time series is not long enough to have significant statistics for long relaxation times.
To improve this, we averaged over 1000 measurements;
python2 OpenDLS.py 1000
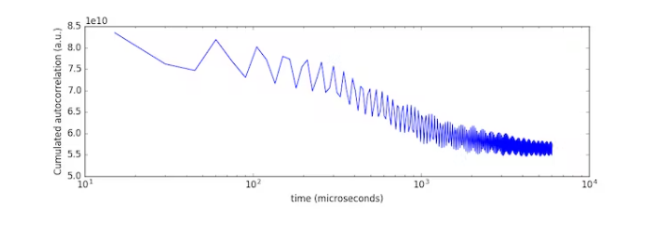
Now the tail is fixed, although it's still noisy. We are ready to analyze the data!
For a monodisperse sphere, the autocorrelation function should be a decreasing exponential, so we fit a, b, and c:
g(tau) = a + b*exp(-c*tau)
c is theoretically 2* q ** 2* D . q is the scattering vector:
q = 4*pi* n_s *sin(theta /2)/lambda, n_s is the refractive index of the solvent, theta is the scattering angle, and lambda is the wavelength of the laser.
D is the diffusion coefficient of the particle from the Stokes-Einstein relation:
D = k*T / (6*pi* Rh * eta_s ), where k is the Boltzmann constant, T is the temperature, Rh is the hydrodynamic radius of the particle, and eta_s is the viscosity of the solvent.
Take 200nm polystyrene dispersion as an example
We have a standard 188 (+/-4) nm polystyrene bead, 2.2% by mass in water (Sigma-Aldrich 95581), which is white and opaque like milk. When diluted to 0.01% mass dispersion we get a clear but slightly turbid liquid that scatters enough light to the detector. The following figure is the average of 1000 time series:
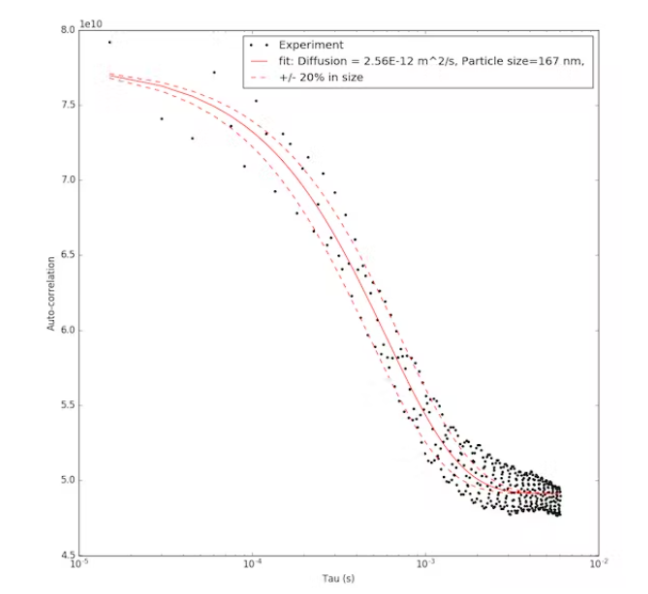
We fit a particle size of 167 nm, with the noise contained in a window of +/-20% (at the slope of the curve).
The systematic underestimation of particle size and the strong noise probably come from multiple scattering of the beam before it reaches the detector. This can be improved by diluting the sample, but detection will be harder since we are playing with the limitations of our system here.
Averaging more time series does not help reduce the noise, as we can see from these 10,000 averages, which took 45 minutes to complete:
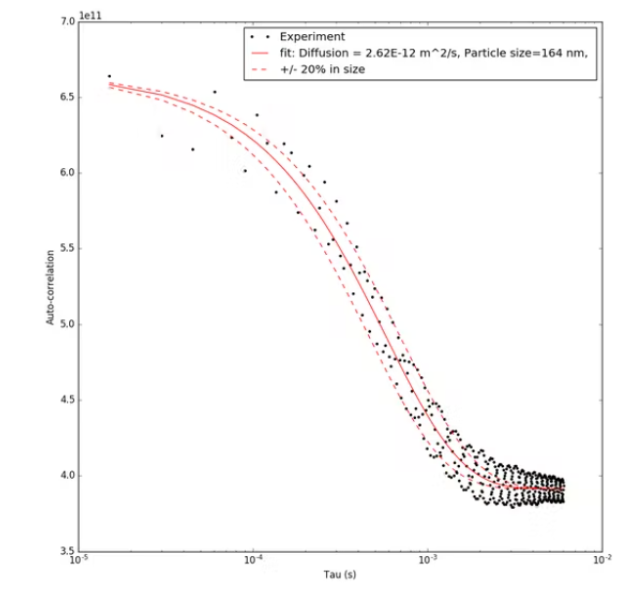
Ideally, we would need to repeat this experiment with other particle sizes to see if the correlation we observe is truly from the liquid and not from the hardware.
in conclusion
This open source DLS device seems very promising for dispersions that scatter enough light to a cheap detector, although accuracy is still low. We hope that some of the building blocks and code will be useful for other projects.
Regarding DLS, possible future expansion:
Automatically turns off the laser when the lid is opened.
Better detectors for transparent solutions (op amps with zero offset capability, photodiodes in avalanche or Geiger mode, aperture pinhole systems for selecting precise scattering angles).
Temperature probe for regulating temperature and viscosity during mixing.
Using a galvanic detector, the backscattered light from the turbid liquid is studied.
- How to build a light source that adjusts its brightness based on atmospheric conditions
- Share a solar beacon circuit
- Share an electronic mouse repellent circuit
- How to Build a Simple Yet Powerful MP3 Player
- How to Design a Solar Cellular Weather Station Using Particle Boron
- Design a pet NFC timer feeder
- A simple memory reader/writer
- Easy-to-make integrated circuit signal tracker circuit
- How to Build a Low-Cost Arduino MiniCNC Plotter
- How to Design a Smart Garbage Monitoring System Using IoT
- Car turning flasher circuit 2
- Leakage pulse detector circuit diagram A
- Negative peak detector circuit diagram B
- Large bandwidth peak detector circuit diagram
- Touch switch or proximity detector circuit diagram
- Dual level detector circuit diagram
- MOS logic circuit control zero-crossing detector circuit
- Ionization chamber smoke detector circuit diagram A
- Unlatched photoelectric smoke detector circuit diagram
- Lead Acid Battery Low Voltage Detector Circuit


 京公网安备 11010802033920号