1 System Working Principle
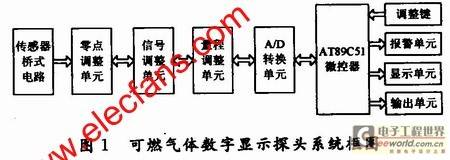
The combustible gas alarm consists of a sensor detection bridge, a DC amplifier, an A/D conversion unit, a zero point, a range adjustment unit, a single-chip microcomputer, an alarm display circuit, and an output circuit. The system block diagram is shown in Figure 1. First, the tiny voltage signal corresponding to the concentration of the combustible gas sent by the sensor is amplified, and then converted into a digital signal by the A/D conversion circuit and sent to the single-chip microcomputer. The single-chip microcomputer then filters the digital signal and analyzes the processed data to confirm whether it is greater than or equal to a certain alarm value. If it is greater than the alarm value, the alarm circuit is activated to emit an audible and visual alarm, otherwise it is a normal state. Then the digital signal is sent to the display unit to display the corresponding concentration value.
2 Hardware Circuit Design
2.1 Combustible gas sensor
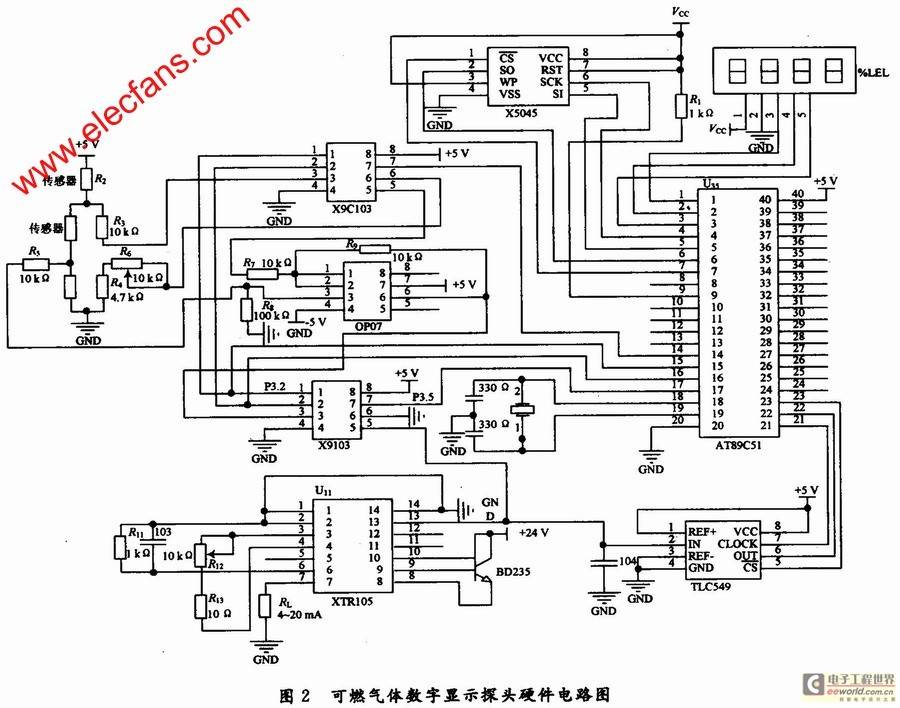
After experimental comparison, the design uses the semiconductor metal oxide combustible gas sensor TGS842. This highly stable sensor needs to work at a certain high temperature to achieve its redox reaction, so it must have a voltage to heat it, and the heating voltage is provided by a +5 V power supply. The measurement method of this sensor is: it forms a Wheatstone detection bridge circuit. When the mixed gas containing flammable substances diffuses onto the detection element, a redox reaction will occur on the surface of the gas sensitive element, causing the resistance value to change, breaking the balance of the bridge, and generating a small voltage difference signal proportional to the concentration of the combustible gas, thereby achieving the purpose of detecting the concentration of the combustible gas. The process is shown in Figure 2.
2.2 Signal Conditioning Circuit
The signal output by the sensor is a weak signal, which needs to be linearly amplified by the integrated operational amplifier OP07 to meet the requirements of the A/D conversion circuit for the level signal. However, before the signal is input, a high-precision digital potentiometer X9C103 with a resistance value of 100 and capable of accurately adjusting the drift signal needs to be added to zero the input drift signal so that it does not enter the operational amplifier OP07. The specific process is: one end of the signal output by the bridge is zeroed by X9C103 (controlled by P3.4); it enters the inverting input terminal (pin 2) of OP07, and the output voltage V. is connected to the inverting input terminal (pin 2) and the zero adjustment terminal (pin 1) through resistor R9 to ensure that negative feedback is introduced; the other end is introduced into the amplifier by the non-inverting input terminal (pin 3), and after amplification, it is realized by another X9C103 (controlled by P3.5) to realize the external adjustment of the range.
The signal passes through two digital potentiometers and reaches the A/D conversion unit. The A/D conversion unit is implemented by the TLC549 chip, which realizes the A/D conversion by the 8-bit switch capacitor successive approximation method. The analog signal is introduced by ANVIN, which communicates with AT89C51 through CLOCK and DATA OUT. When it becomes low, the TLC549 chip is selected, and the most significant bit MSB (A7) of the previous conversion result is output from the DATA OUT terminal. Then the CLOCK terminal outputs 8 external clock signals. The role of the first 7 CLOCK signals is to cooperate with TLC549 to output the previous conversion results A6~A0 and prepare for this conversion. After the 4th CLOCK signal changes from high to low, the on-chip sampling and holding circuit starts sampling the input analog quantity. The falling edge of the 8th CLOCK signal causes the on-chip sampling and holding circuit to enter the holding state and start the A/D conversion.
In order to make the circuit work reliably and stably, X5045 is used to realize the circuit monitoring function. X5045 has a watchdog timer that can be set to 200 ms, 600 ms, 1.4 s or disabled. In this circuit, X5045 is set to a 1.4 s timer. The hardware circuit is shown in Figure 2. In the microcontroller program, a "feed the dog" instruction is placed at a certain time interval (that is, a falling edge is output at P1.6). The time interval should be less than 1.4 s to ensure that X5045 will not overflow when the program runs normally; when the program is abnormal, the time interval will exceed 1.4 s, causing X5045 to overflow, and a reset signal is sent through the RST pin to reset the microcontroller and restart the program.
2.3 Output Unit
The field voltage signal of the sensor is converted into a 4-20 mA standard current signal by a voltage/current converter and then transmitted to the host control system. In order to realize the conversion of the voltage signal into a 4-20 mA standard current signal, the XTRl05 precision current transmitter is used. It contains a high-precision instrument amplifier, a voltage/current converter and two identical 0.8 mA precision constant current source references. The voltage signal of the sensor is input from pin 13; a sliding resistor is connected between pins 3 and 4 to adjust the output full amplitude; pins 1, 2, and 14 are connected to the power supply, and the I/O pin is connected to the positive end of the 24 V power supply (and the loop injection end); pin 7 is connected to the negative end of the power supply through the load resistor RL (also the loop signal output end); pins 8 and 9 are connected to the BD235 transistor, which is the main current conduction device of the 4-20 mA current loop and can strictly separate the external power supply current from the internal consumption of XTRl05.
2.4 Zero point, span adjustment and alarm unit
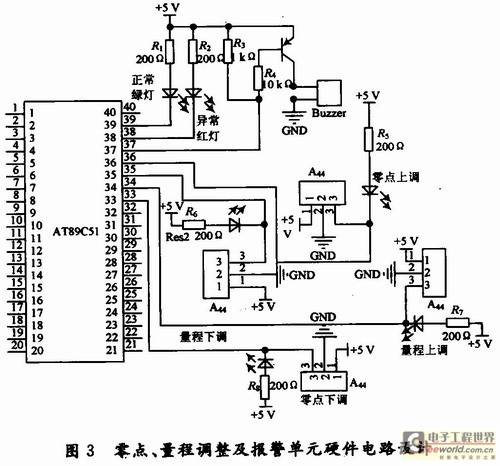
The range of this probe is 0~100%LEL, and the zero point and range can be adjusted appropriately for different environments. The key circuit adopts Hall element A44, which can be placed inside the meter head, which improves the safety of the probe, thereby improving the shortcomings of the key being susceptible to corrosion and not conducive to the sealing of the device. Under the action of the external magnetic field, when the magnetic induction intensity exceeds the conduction threshold, the Hall output tube is turned on and outputs a low level. On the contrary, the Hall output tube is cut off and outputs a high level. For combustible gas detectors, the sound and light alarm part is indispensable. When the combustible gas concentration is less than the safe value, the green light is on, but when the combustible gas concentration is greater than the safe value, the red light is on, accompanied by the buzzer sounding. That is, when it is detected that the proportion of combustible gas in the air exceeds the standard, an audible and light alarm is issued to prevent accidents caused by excessive combustible gas content. As shown in Figure 3.
2.5 Power Module Design
The control system is powered by a unified 24 V DC power supply, but the AT89C51 and TGS842 sensors require a +5 V power supply, while the OP07 requires a -5 V power supply, which requires a voltage conversion unit. The MC34063 chip can be used to achieve voltage conversion from +24 V to +5 V. The MC34063 chip is a monolithic DC/DC converter. Figure 4 shows a switch buck circuit using the MC34063 chip. When the internal switch tube of the chip is turned on, the current passes through the 1st and 2nd pins of the MC34063 to supply power to the inductor L1, L2, the capacitor G3 and the load, and the inductor L1 and L2 store energy; when the internal switch tube is turned off, the inductor L1 and L2 continue to supply power to the capacitor C3 and the load, and output a +5 V power supply voltage. As shown in Figure 5.
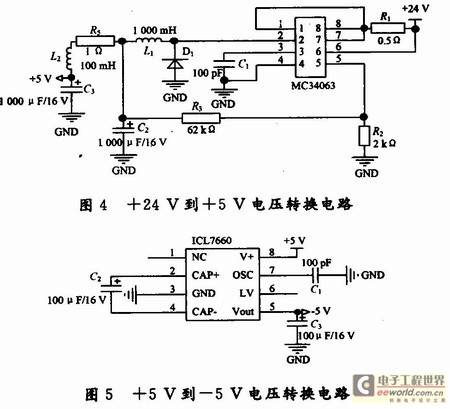
ICL7660 contains four analog switches S1~S4, which are controlled by the internal oscillator and turned on and off in a certain order. Two ordinary electrolytic capacitors C2 and C3 are connected to pins 2, 4 and 5 respectively. When S1 and S3 are closed and S2 and S4 are open, C2 is charged to +5 V. After a period of time, when S1 and S3 are open and S2 and S4 are closed, the charge on C2 is transferred to C3. After several cycles, the voltage on C3 is equal to -5 V, thus realizing the conversion from positive voltage to negative voltage.
3 Software Design
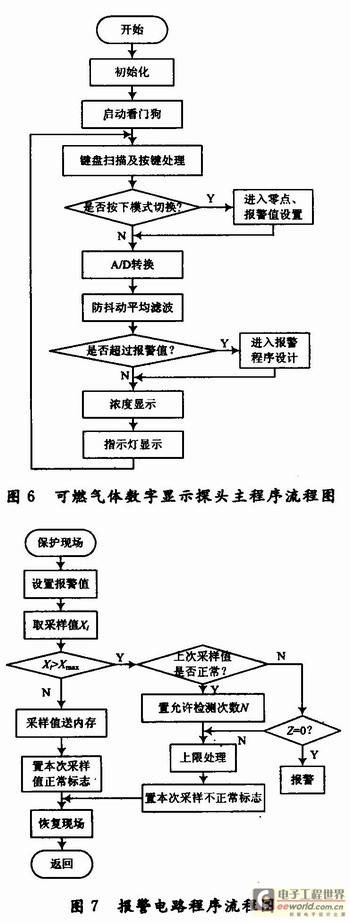
The software functions of the system mainly include: A/D conversion of the detected gas concentration signal, pulse interference prevention average filtering, status indicator and key function setting, liquid crystal display module to display the gas concentration value and alarm circuit design, etc. The main program flow is shown in Figure 6.
3.1 Design of alarm circuit
The design idea of the alarm program is to first input the alarm value into the Xmax unit, and then obtain the current sampling value Xi and compare it with Xmax. If it is less than the alarm value, the current sampling is normal, and the normal value can be sent to the RESULT unit and the flag bit O (indicating normal) is set. If it is greater than the alarm value, it will be transferred to the alarm processing. When performing the alarm processing, first determine whether the previous sampling is normal. If it is normal, you can re-sample, set the number of abnormal detections allowed N, and then transfer to the alarm processing program; if it is not normal, check whether it is abnormal for N consecutive times. If yes, then alarm; if not, then store the remaining number of continuous abnormalities Z allowed in the counting unit, and then perform the alarm processing, set the abnormal flag of this sampling and return to the main program. The alarm circuit program flow is shown in Figure 7.
3.2 Design of filter circuit
Changes in the working environment may cause the gas sensor to encounter sharp pulse interference when sampling gas concentration. This interference is generally short-lived and has a large peak value. When digital filtering is performed on it, only arithmetic average or moving average filtering can only process 1/n of the pulse interference, and its residual value is still large. The best strategy is to remove the data of the interfered signal, that is, the anti-pulse interference average filtering method. The algorithm is: sort the continuous n data, remove the largest and smallest 2 data, and average the remaining data. In order to speed up data processing, the value of n is 8.
However, this algorithm still has a shortcoming, that is, each data collected must be sorted, which will take up a lot of system time. The solution is to use two variables in the system to store the offset of the maximum and minimum values of the current n data in this array. Only when the data covered by the new input data happens to be the current maximum or minimum value, will the maximum or minimum value be found in the next array; in other cases, the maximum and minimum values can be modified by comparing the input data with the maximum and minimum values, and there is no need to sort the data. The software flow chart of the filter circuit is shown in Figure 8.

4 Conclusion
The combustible gas digital display probe designed in this paper has the characteristics of stable structure, high measurement accuracy, good sealing and maintainability. The instrument uses LCD to display the concentration of combustible gas, and sends out sound and light alarms when its concentration reaches the set concentration. The fault self-diagnosis function can quickly repeat detection and delay alarm. At the same time, the alarm can also communicate with the host computer control system, which can not only transmit gas concentration detection data to the control system in real time for record preservation, but also use the host computer control system to realize remote real-time detection and linkage device control functions.
Previous article:Design of Elliptic Function Low-pass Filter Based on DDS
Next article:Design of AC Motor Frequency Conversion Speed Regulation System Based on DSP
- Popular Resources
- Popular amplifiers
- Huawei's Strategic Department Director Gai Gang: The cumulative installed base of open source Euler operating system exceeds 10 million sets
- Analysis of the application of several common contact parts in high-voltage connectors of new energy vehicles
- Wiring harness durability test and contact voltage drop test method
- Sn-doped CuO nanostructure-based ethanol gas sensor for real-time drunk driving detection in vehicles
- Design considerations for automotive battery wiring harness
- Do you know all the various motors commonly used in automotive electronics?
- What are the functions of the Internet of Vehicles? What are the uses and benefits of the Internet of Vehicles?
- Power Inverter - A critical safety system for electric vehicles
- Analysis of the information security mechanism of AUTOSAR, the automotive embedded software framework
 Professor at Beihang University, dedicated to promoting microcontrollers and embedded systems for over 20 years.
- Innolux's intelligent steer-by-wire solution makes cars smarter and safer
- 8051 MCU - Parity Check
- How to efficiently balance the sensitivity of tactile sensing interfaces
- What should I do if the servo motor shakes? What causes the servo motor to shake quickly?
- 【Brushless Motor】Analysis of three-phase BLDC motor and sharing of two popular development boards
- Midea Industrial Technology's subsidiaries Clou Electronics and Hekang New Energy jointly appeared at the Munich Battery Energy Storage Exhibition and Solar Energy Exhibition
- Guoxin Sichen | Application of ferroelectric memory PB85RS2MC in power battery management, with a capacity of 2M
- Analysis of common faults of frequency converter
- In a head-on competition with Qualcomm, what kind of cockpit products has Intel come up with?
- Dalian Rongke's all-vanadium liquid flow battery energy storage equipment industrialization project has entered the sprint stage before production
- Allegro MicroSystems Introduces Advanced Magnetic and Inductive Position Sensing Solutions at Electronica 2024
- Car key in the left hand, liveness detection radar in the right hand, UWB is imperative for cars!
- After a decade of rapid development, domestic CIS has entered the market
- Aegis Dagger Battery + Thor EM-i Super Hybrid, Geely New Energy has thrown out two "king bombs"
- A brief discussion on functional safety - fault, error, and failure
- In the smart car 2.0 cycle, these core industry chains are facing major opportunities!
- The United States and Japan are developing new batteries. CATL faces challenges? How should China's new energy battery industry respond?
- Murata launches high-precision 6-axis inertial sensor for automobiles
- Ford patents pre-charge alarm to help save costs and respond to emergencies
- New real-time microcontroller system from Texas Instruments enables smarter processing in automotive and industrial applications
- MSP430F5529 USB Experimenter Board
- 【AT-START-F425 Review】No.03 Debugging serial port, timer and main system frequency
- Consulting circuit!!!
- Annoying Technology 3
- Xianji official engineer's dry goods: quickly familiar with the use of HPM6750 PWM and HPM_SDK Driver API (lighting)
- Check it out: Things that ST New Chinese official forum doesn’t want to tell netizens
- HyperLynx High-Speed Circuit Design and Simulation (IV) Transmission Line Crosstalk
- What are the advantages of electronic shelf labels with Bluetooth 5.0 technology?
- DSP-F28335 System Resources
- msp430f5529 interrupt notes

 The authoritative guide to AR development: Based on AR Foundation (Wang Xiangchun)
 red magic probe code for raspberry pi zero w extend board


 京公网安备 11010802033920号