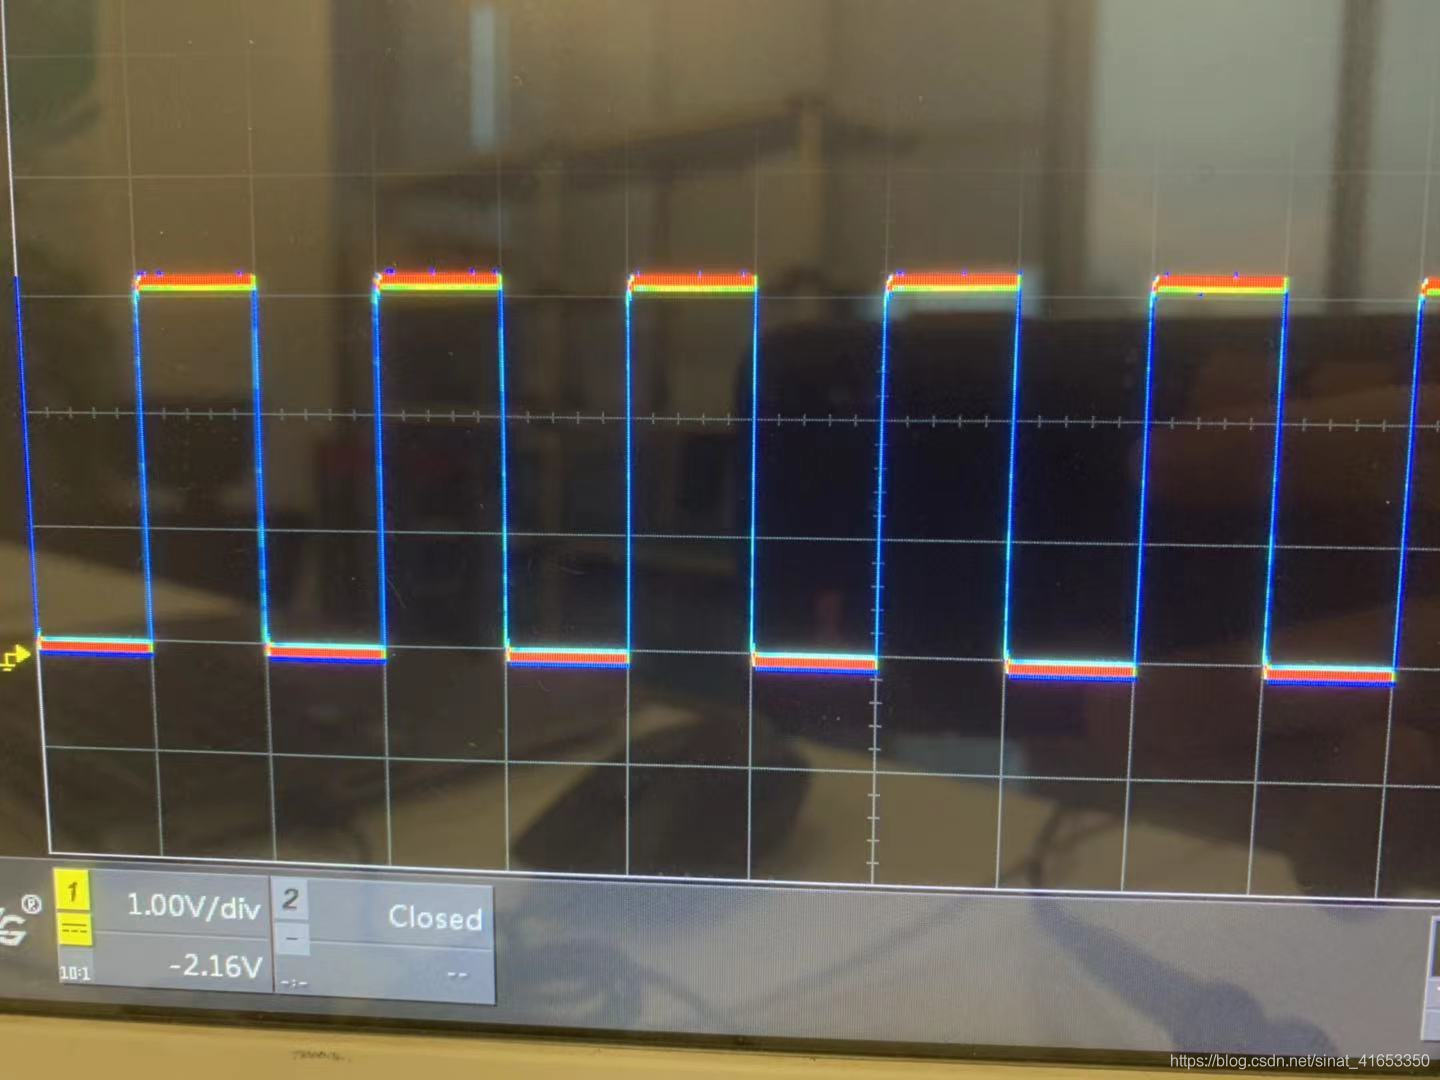
Color temperature display
As we all know, in the normal display mode of the oscilloscope, the grayscale size is used to indicate the probability of the waveform occurring.
The greater the probability of a waveform appearing, the brighter the color of the waveform.
The smaller the probability of a waveform occurring, the darker the color of the waveform.
In order to more clearly understand the probability of the waveform occurring, use the color temperature display function.
To put it simply, the warmth or coldness of the waveform color temperature is used to reflect the probability of the waveform appearing.
Waveforms that occur less frequently are displayed in cool colors, and waveforms that occur more frequently are displayed in warm colors.

The persist button on the oscilloscope can switch between infinite persistence mode and color temperature display mode.
In the color temperature display mode, the waveform color is brighter, the contrast is better, and it is easier to observe the waveform trajectory.

Freeze Display
The freeze display function is turned on in the display menu.
For ease of understanding, we assume that the oscilloscope can collect 10,000 frames of waveform data within the total capture time of each screen.

When the user turns on the freeze display mode, once the stop key is pressed, the latest 10,000 frames of waveform data collected will be displayed on the screen, which can help observe the waveform details contained in these 10,000 frames of data.
These 10,000 frames of waveform data only apply to the moment of stop.
At this time, if we perform other operations, the waveform displayed on the screen will immediately change from displaying all 10,000 frames of waveform to displaying only the waveform data of the 10,000th frame.

When the freeze mode is not turned on, the oscilloscope uses real-time sampling. When the stop key is pressed, the waveform of the latest frame will be displayed on the screen, accurately reconstructing the waveform and measuring the signal accurately.
Previous article:How to collect sound waveform and frequency_Oscilloscope acquisition mode
Next article:Comparison of trigger functions of three oscilloscopes: Yokogawa, LeCroy, and Tektronix
- Popular Resources
- Popular amplifiers
- Keysight Technologies Helps Samsung Electronics Successfully Validate FiRa® 2.0 Safe Distance Measurement Test Case
- From probes to power supplies, Tektronix is leading the way in comprehensive innovation in power electronics testing
- Seizing the Opportunities in the Chinese Application Market: NI's Challenges and Answers
- Tektronix Launches Breakthrough Power Measurement Tools to Accelerate Innovation as Global Electrification Accelerates
- Not all oscilloscopes are created equal: Why ADCs and low noise floor matter
- Enable TekHSI high-speed interface function to accelerate the remote transmission of waveform data
- How to measure the quality of soft start thyristor
- How to use a multimeter to judge whether a soft starter is good or bad
- What are the advantages and disadvantages of non-contact temperature sensors?
- Innolux's intelligent steer-by-wire solution makes cars smarter and safer
- 8051 MCU - Parity Check
- How to efficiently balance the sensitivity of tactile sensing interfaces
- What should I do if the servo motor shakes? What causes the servo motor to shake quickly?
- 【Brushless Motor】Analysis of three-phase BLDC motor and sharing of two popular development boards
- Midea Industrial Technology's subsidiaries Clou Electronics and Hekang New Energy jointly appeared at the Munich Battery Energy Storage Exhibition and Solar Energy Exhibition
- Guoxin Sichen | Application of ferroelectric memory PB85RS2MC in power battery management, with a capacity of 2M
- Analysis of common faults of frequency converter
- In a head-on competition with Qualcomm, what kind of cockpit products has Intel come up with?
- Dalian Rongke's all-vanadium liquid flow battery energy storage equipment industrialization project has entered the sprint stage before production
- Allegro MicroSystems Introduces Advanced Magnetic and Inductive Position Sensing Solutions at Electronica 2024
- Car key in the left hand, liveness detection radar in the right hand, UWB is imperative for cars!
- After a decade of rapid development, domestic CIS has entered the market
- Aegis Dagger Battery + Thor EM-i Super Hybrid, Geely New Energy has thrown out two "king bombs"
- A brief discussion on functional safety - fault, error, and failure
- In the smart car 2.0 cycle, these core industry chains are facing major opportunities!
- The United States and Japan are developing new batteries. CATL faces challenges? How should China's new energy battery industry respond?
- Murata launches high-precision 6-axis inertial sensor for automobiles
- Ford patents pre-charge alarm to help save costs and respond to emergencies
- New real-time microcontroller system from Texas Instruments enables smarter processing in automotive and industrial applications
- STMicroelectronics launches the second generation multi-zone time-of-flight sensor VL53L8
- EEWORLD University - Wildfire FreeRTOS Kernel Implementation and Application Development Practical Guide
- Teach you how to make a lithium battery fast charging charger
- Solution to the problem of not being able to generate electrical connection network using Harness in Altium Designer
- 【ufun learning】02 Concept and preliminary circuit design 1
- 【RT-Thread Reading Notes】Reflections on RT-Thread Chapters 7-8
- DC-DC chip LM2596SX-5.0/NOPB
- How does the lwip client let the server know that it has been shut down?
- Small car front-end 16W power supply design
- Bear Pie Huawei IoT operating system LiteOS bare metal driver transplantation 05-E53_SF1 expansion board driver and use

 CMSIS_RTOS_Tutorial


 京公网安备 11010802033920号