One issue associated with signal measurement is the ability to distinguish between a large fundamental signal and smaller distortion products. The dynamic range of a spectrum analyzer specifies the maximum range within which the spectrum analyzer can distinguish between signal and distortion, signal and noise, or signal and phase noise.
AnswerOne
issue associated with signal measurements is the ability to distinguish between a large fundamental signal and smaller distortion products. The dynamic range of a spectrum analyzer specifies the maximum range over which the spectrum analyzer can distinguish between signal and distortion, signal and noise, or signal and phase noise.
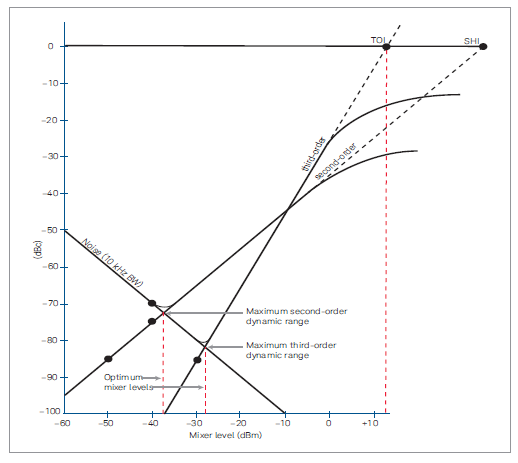
When measuring signal and distortion, the mixer level determines the dynamic range of the spectrum analyzer. The mixer level that optimizes the dynamic range is determined by the spectrum analyzer's 2nd harmonic distortion, 3rd order intermodulation distortion, and displayed average noise level (DANL). These specifications can be used to plot the internally generated distortion and noise versus mixer level.
Figure 1 shows the -75 dBc 2nd harmonic distortion point at a -40 dBm mixer level, the -85 dBc 3rd order distortion point at a -30 dBm mixer level, and the -110 dBm noise floor at a 10 kHz RBW. The slope of the 2nd harmonic distortion line is 1 because the SHD increases by 2 dB for every 1 dB increase in the mixer fundamental level. But since distortion is determined by the difference between the fundamental and the distortion components, it changes by only 1 dB. Similarly, the slope of the plotted third-order distortion is 2. For every 1 dB change in mixer level, the third-order component changes by 3 dB, or 2 dB relative. The maximum second- and third-order dynamic range is obtained by setting the mixer level where the second- or third-order distortion equals the noise floor, and the corresponding mixer levels are marked in the figure.

Figure 1. Dynamic range—distortion and noise.
Dynamic range must be increased by narrowing the resolution bandwidth. As shown in Figure 2, the dynamic range increases when the RBW setting is reduced from 10 kHz to 1 kHz. Note that the increase is 5 dB for second-order distortion and 6 dB for third-order distortion.

Figure 2. Dynamic range improvement with reduced resolution bandwidth
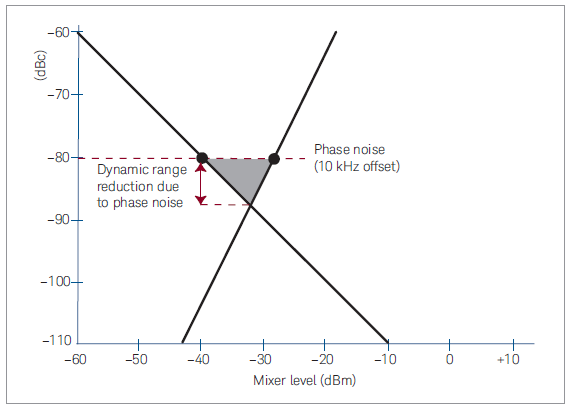
A final point is that the dynamic range of intermodulation distortion is affected by the spectrum analyzer phase noise, since the frequency spacing of the different spectral components (the measured spectrum and the distortion products) is equal to the spacing of the measured spectral lines. Figure 3 shows the noise curve obtained with a 1 kHz resolution bandwidth for the measured spectral lines spaced 10 kHz apart. If the phase noise at 10 kHz is only -80 dBc, then for this measurement, 80 dB becomes the ultimate limit of dynamic range, rather than the maximum 88 dB dynamic range shown in Figure 3.

Figure 3. Phase noise limited third-order intermodulation product test.
Previous article:What is the fastest pulse rise time that a spectrum analyzer can measure at zero span?
Next article:What is PowerSuite One-click power measurement
Recommended ReadingLatest update time:2024-11-16 20:33

- Keysight Technologies Helps Samsung Electronics Successfully Validate FiRa® 2.0 Safe Distance Measurement Test Case
- From probes to power supplies, Tektronix is leading the way in comprehensive innovation in power electronics testing
- Seizing the Opportunities in the Chinese Application Market: NI's Challenges and Answers
- Tektronix Launches Breakthrough Power Measurement Tools to Accelerate Innovation as Global Electrification Accelerates
- Not all oscilloscopes are created equal: Why ADCs and low noise floor matter
- Enable TekHSI high-speed interface function to accelerate the remote transmission of waveform data
- How to measure the quality of soft start thyristor
- How to use a multimeter to judge whether a soft starter is good or bad
- What are the advantages and disadvantages of non-contact temperature sensors?
- Innolux's intelligent steer-by-wire solution makes cars smarter and safer
- 8051 MCU - Parity Check
- How to efficiently balance the sensitivity of tactile sensing interfaces
- What should I do if the servo motor shakes? What causes the servo motor to shake quickly?
- 【Brushless Motor】Analysis of three-phase BLDC motor and sharing of two popular development boards
- Midea Industrial Technology's subsidiaries Clou Electronics and Hekang New Energy jointly appeared at the Munich Battery Energy Storage Exhibition and Solar Energy Exhibition
- Guoxin Sichen | Application of ferroelectric memory PB85RS2MC in power battery management, with a capacity of 2M
- Analysis of common faults of frequency converter
- In a head-on competition with Qualcomm, what kind of cockpit products has Intel come up with?
- Dalian Rongke's all-vanadium liquid flow battery energy storage equipment industrialization project has entered the sprint stage before production
- Allegro MicroSystems Introduces Advanced Magnetic and Inductive Position Sensing Solutions at Electronica 2024
- Car key in the left hand, liveness detection radar in the right hand, UWB is imperative for cars!
- After a decade of rapid development, domestic CIS has entered the market
- Aegis Dagger Battery + Thor EM-i Super Hybrid, Geely New Energy has thrown out two "king bombs"
- A brief discussion on functional safety - fault, error, and failure
- In the smart car 2.0 cycle, these core industry chains are facing major opportunities!
- The United States and Japan are developing new batteries. CATL faces challenges? How should China's new energy battery industry respond?
- Murata launches high-precision 6-axis inertial sensor for automobiles
- Ford patents pre-charge alarm to help save costs and respond to emergencies
- New real-time microcontroller system from Texas Instruments enables smarter processing in automotive and industrial applications
- [Technical Live Broadcast] Experts from MPS, Nexperia, and Tektronix gathered to discuss the key points of new energy vehicle power design
- Dogecoin suddenly became popular. Here is a tutorial on graphics card mining
- Power Supply Design Considerations
- Weekly review information is here~
- Learning Linux kernel semaphores on SinlinxA33 development board
- STM32 encoder signal interference.
- [GD32L233C-START Evaluation] +ADC collects PT1000 to obtain temperature
- Three traditional methods of wireless video transmission
- Displaying the SARS-CoV-2 virus with flashing LEDs
- How to improve simulation? Learn to generate LTspice models yourself

 Multimodal perception parameterized decision making for autonomous driving
 CVPR 2023 Paper Summary: Robotics


 京公网安备 11010802033920号