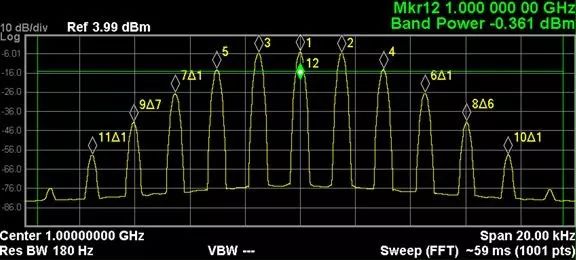
Marker
Anyone who has used a spectrum analyzer knows the importance of a marker. Whether measuring frequency or amplitude, we cannot do without this small marker.

There are two common uses of Marker:
1. Place the marker on the spectrum analyzer trace (spectrum line) to obtain the absolute frequency and amplitude of the signal. In order to obtain the best frequency accuracy, the marker must be carefully placed at the peak of the spectrum component response. If there is a slight deviation, the frequency reading will be inaccurate.
We can minimize their effects by narrowing the span and resolution bandwidth, making it easier to place the marker at the peak.
2. Difference Marker. This is a relative test. We first determine a fixed marker, and then establish a second marker. This marker is active and can be placed anywhere on the spectrum.
The displayed readouts indicate the relative frequency separation and amplitude difference between the fixed and active markers.
Based on the user feedback we collected, we summarized the following common problems:
What is the use of oMarker table?
oCan I use a marker to measure noise?
oCan the power of digitally modulated signals be measured using a marker?
What is the role of marker in oEMI debugging?
Although Marker is simple, it is not easy to use it well. If you want to know the answers to these questions, watch the video below!
Harmonic Measurement
Before talking about harmonic measurement, let's review this classic time domain and frequency domain measurement comparison chart. This chart shows the waveform of a composite signal. Obviously, the oscilloscope's graphical signal is not a pure sine shape, and it is difficult to determine the reason by observation alone.
According to the frequency domain measurement results, the signal spectrum consists of exactly three sine waves. Now we know why the original signal is not a pure sine wave, because it also contains two other sinusoidal components, in this case the second and third harmonics.

Usually the harmonic measurement requirements come from two aspects:
On the one hand, the design requires the use of harmonics. For example, the spectrum analyzer itself uses harmonic mixing technology.
Another requirement is EMI testing, where we measure harmonics as a distortion signal. We are concerned that excessive harmonic distortion at the transmitter output will interfere with systems in other frequency bands.
When measuring harmonic distortion, we use the fundamental wave of the signal as a reference. The absolute value is not considered, but only the amplitude difference between the harmonic and the fundamental wave is of interest.
According to the regulations set by government agencies or industry standards, EMI electromagnetic interference testing requires the measurement of the 5th or 10th harmonics. As the harmonic order increases, the amplitude of the harmonic becomes lower and lower, which brings considerable trouble to the accurate measurement of high-order harmonics.

The N9000B signal analyzer comes standard with a harmonic measurement function that can automatically search for fundamental waves and complete measurements of up to 10 harmonics. For each harmonic frequency point, the N9000B will automatically set the best test parameters for measurement.
Want to know how smart this harmonic measurement is? Just watch this short video!
Have you got the above two tips?

Previous article:Various signals are input into the spectrum analyzer, and the performance of zero intermediate frequency after I/Q demodulation
Next article:What are the application advantages of 4M sample points in spectrum analysis?
- Popular Resources
- Popular amplifiers
- From probes to power supplies, Tektronix is leading the way in comprehensive innovation in power electronics testing
- Seizing the Opportunities in the Chinese Application Market: NI's Challenges and Answers
- Tektronix Launches Breakthrough Power Measurement Tools to Accelerate Innovation as Global Electrification Accelerates
- Not all oscilloscopes are created equal: Why ADCs and low noise floor matter
- Enable TekHSI high-speed interface function to accelerate the remote transmission of waveform data
- How to measure the quality of soft start thyristor
- How to use a multimeter to judge whether a soft starter is good or bad
- What are the advantages and disadvantages of non-contact temperature sensors?
- In what situations are non-contact temperature sensors widely used?
- LED chemical incompatibility test to see which chemicals LEDs can be used with
- Application of ARM9 hardware coprocessor on WinCE embedded motherboard
- What are the key points for selecting rotor flowmeter?
- LM317 high power charger circuit
- A brief analysis of Embest's application and development of embedded medical devices
- Single-phase RC protection circuit
- stm32 PVD programmable voltage monitor
- Introduction and measurement of edge trigger and level trigger of 51 single chip microcomputer
- Improved design of Linux system software shell protection technology
- What to do if the ABB robot protection device stops
- Huawei's Strategic Department Director Gai Gang: The cumulative installed base of open source Euler operating system exceeds 10 million sets
- Download from the Internet--ARM Getting Started Notes
- Learn ARM development(22)
- Learn ARM development(21)
- Learn ARM development(20)
- Learn ARM development(19)
- Learn ARM development(14)
- Learn ARM development(15)
- Analysis of the application of several common contact parts in high-voltage connectors of new energy vehicles
- Wiring harness durability test and contact voltage drop test method
- Wish you all a happy Dragon Boat Festival
- Using MCU to implement speech recognition? MSP432 can do it!
- I haven't seen any boys do better than me. She got 692 points and wants to be a programmer! Do you think programmers are still popular?
- All future ESP32 SoCs will be based on RISC-V
- Lead Angle/Conduction Angle of Brushless DC Motor
- FIR filter design based on FPGA (source code download attached)
- The timing relationship between voltage and current lead and lag
- NE555 Internal Structure
- PADS Packaging
- MSP430 development and programming environment construction

 5962-8686001EA


 京公网安备 11010802033920号