0 Introduction
Temperature is a very important parameter in industrial production and scientific research experiments. Many physical phenomena and chemical properties of objects are related to temperature. Many production processes are carried out within a certain temperature range. The occasions where temperature measurement and control are needed are extremely extensive. The current temperature measurement control system often uses single-chip microcomputer control. This technology is widely used, but its programming is complex, the control is unstable, and the system accuracy is not high. The temperature measurement system developed and designed using virtual instrument technology uses an ordinary PC as the host and uses the graphical visual test software LabVIEW as the software development platform to monitor temperature changes, collect data, and process, store, and display it. The equipment has low cost, is convenient and flexible to use, and is suitable for industrial and agricultural production and teaching.
1 Introduction to virtual instrument technology and LabVIEW
Virtual technology, computer communication technology, and network technology are the three core technologies of information technology, among which virtual instruments are an important part of virtual technology. Virtual instrument (VI for short) is the latest generation of measuring instruments that breaks through the concept of traditional instruments. It uses high-performance modular hardware, combined with efficient and flexible software, and is defined by the user to complete various test, measurement, and control applications. Its essential feature is: "Software is the instrument." It is a computer-based software and hardware testing platform that can replace traditional measuring instruments such as oscilloscopes, logic analyzers, signal generators, spectrum analyzers, etc.; it can be integrated into automatic control and industrial control systems; it can be freely built into a proprietary instrument system. Virtual instrument technology has four major advantages: high performance, strong scalability, less development time and excellent integration, making it the development trend of modern measurement and control technology.
LabVIEW (Laboratory Virtual Instrument Engineering Workbench) is a program development environment. It uses the graphical programming language G to create source programs in flow charts instead of using text-based languages to generate source program codes. LabVIEW also integrates all functions such as hardware communications that meet GPIB, VXI, RS-232 and RS-485, and data acquisition cards. It has built-in library functions that facilitate software standards such as TCP/IP and Active X. LabVIEW programs are called virtual instruments (VIs) because their appearance and operation can imitate actual instruments. Even if users do not have much programming experience, they can also use LabVIEW to develop their own applications.
2 System Solution Design
The virtual instrument temperature measurement system uses virtual instrument technology to transform traditional temperature measuring instruments to make them more powerful. The system framework is shown in Figure 1. The instrument system converts the temperature of the object to be measured into analog signals such as voltage or current through the sensor element of the front-end temperature sensing device. After power amplification, filtering and other processing by the signal conditioning circuit, it is converted into a standard voltage signal that can be collected by the data acquisition card. The analog signal is converted into a digital signal in the data acquisition card, and sent to the computer bus under the data acquisition instruction. The collected data is processed in various ways required by the installed virtual instrument software in the PC.
Figure 1 Schematic diagram of the temperature measurement system
The temperature measurement system based on virtual instrument technology consists of two parts: hardware and software.
2.1 Hardware system design
The hardware system consists of a front-end temperature sensing device (temperature sensor), a data acquisition card, a PC system, etc., and mainly realizes functions such as temperature signal acquisition, conversion, and processing.

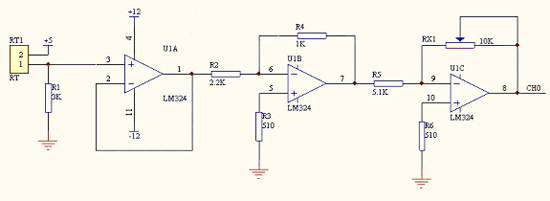
Figure 2 Schematic diagram of the hardware circuit of the temperature measurement system
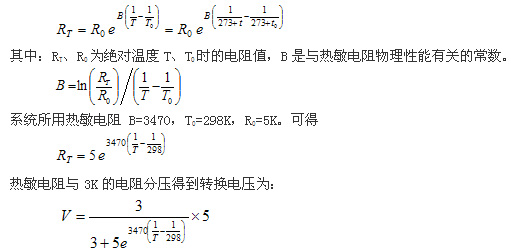
The front-end temperature sensing device of this system uses a thermistor. The thermistor RT1 and R1 are connected in series to divide the voltage, and the circuit output voltage is proportional to the temperature. The sensor usually outputs a small signal, and a suitable signal conditioning circuit (such as amplification) must be used to minimize the quantization error. When the temperature increases, the resistance of thermistor RT1 decreases, and a linear voltage is generated at the voltage divider point. After being maintained by the voltage follower, it is amplified by the LM324 in the first and second stages, and a positive linear voltage proportional to the temperature change is output. The analog voltage output by the measurement circuit is sent to the data acquisition card, converted into a digital signal and then input into the PC. 2.2 Software System Design
The software part mainly performs subsequent data processing, alarm, display and other functions, and specifically implements the acquisition card parameter setting, data calibration, real-time display, temperature limit setting, alarm and human-computer interaction functions.
(1) Sensor calibration
Sensor calibration is to establish the relationship between sensor input and output through experiments. Calibration is a verification procedure that must be performed before the instrument is officially used after the design is completed. For the virtual temperature measurement system, calibration is to obtain the functional relationship between voltage and the temperature of the object being measured, so as to calculate the temperature through voltage.
Thermistors have the advantages of high sensitivity, small size, light weight, long service life, and are suitable for long-distance measurement. However, they have large nonlinear errors and slightly poor stability, so calibration is necessary.
By calibrating the system through the curve fitting method, the temperature corresponding to any voltage within the temperature measurement range can be obtained.
(2) Front panel design
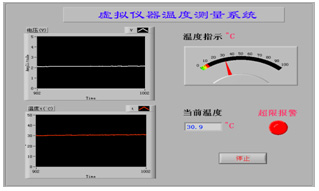
The user interface (front panel) is an important part of the virtual instrument. The settings of instrument parameters and the display of test results are all implemented through software. Therefore, the software interface is required to be simple and direct and easy to use. This system uses LabVIEW8.2 software to design the user interface as shown in Figure 3. The interface can display the changes in the voltage waveform obtained by sensor detection, data card acquisition and conversion. At the same time, the temperature value obtained after calibration is displayed in three ways: waveform, pointer and numerical value. It can meet the needs of different users and set the over-limit alarm indication through the Boolean switch.

Figure 3 System front panel (user interface)
(3) Program flowchart design
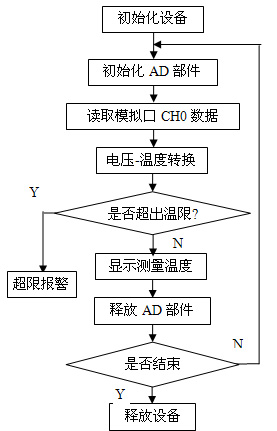
The source program of LabVIEW is a block diagram and provides a very rich library function, from data acquisition to instrument control, from signal generation to signal processing, from data analysis to graphic display, from file reading and writing to network communication. It is very diverse, which greatly improves the efficiency of user programming and reduces the programming workload. The program flowchart design of this system mainly includes modules such as device initialization, AD component initialization, analog data reading, voltage-temperature conversion, data processing and display, over-limit alarm, AD component release, and device release. Some of these modules directly call submodules (library functions) in LabVIEW, such as multiplication, subtraction, over-limit comparison, timer, etc.; some modules such as Create/Release ID, AD Int/Read/Close are implemented by user-defined design.
See Figure 4 and Figure 5 for specific flow charts and program flowcharts .

Figure 4 System flow chart

Figure 5 Temperature measurement system program flowchart
4 Conclusion
The virtual temperature measurement system is realized by using LabVIEW software, which improves working conditions, improves accuracy, saves time, and reduces costs. The system has strong scalability and can further expand its functions, such as realizing remote temperature measurement and control. The method of constructing a measurement and control system in this system can be extended to similar applications and has very important practical significance. The
innovation of this article is that the temperature measurement system is constructed by using virtual instruments, which realizes the intelligent temperature measurement, high accuracy, low cost, and strong versatility and scalability.
Reference address:Design of Virtual Temperature Measurement System
Temperature is a very important parameter in industrial production and scientific research experiments. Many physical phenomena and chemical properties of objects are related to temperature. Many production processes are carried out within a certain temperature range. The occasions where temperature measurement and control are needed are extremely extensive. The current temperature measurement control system often uses single-chip microcomputer control. This technology is widely used, but its programming is complex, the control is unstable, and the system accuracy is not high. The temperature measurement system developed and designed using virtual instrument technology uses an ordinary PC as the host and uses the graphical visual test software LabVIEW as the software development platform to monitor temperature changes, collect data, and process, store, and display it. The equipment has low cost, is convenient and flexible to use, and is suitable for industrial and agricultural production and teaching.
1 Introduction to virtual instrument technology and LabVIEW
Virtual technology, computer communication technology, and network technology are the three core technologies of information technology, among which virtual instruments are an important part of virtual technology. Virtual instrument (VI for short) is the latest generation of measuring instruments that breaks through the concept of traditional instruments. It uses high-performance modular hardware, combined with efficient and flexible software, and is defined by the user to complete various test, measurement, and control applications. Its essential feature is: "Software is the instrument." It is a computer-based software and hardware testing platform that can replace traditional measuring instruments such as oscilloscopes, logic analyzers, signal generators, spectrum analyzers, etc.; it can be integrated into automatic control and industrial control systems; it can be freely built into a proprietary instrument system. Virtual instrument technology has four major advantages: high performance, strong scalability, less development time and excellent integration, making it the development trend of modern measurement and control technology.
LabVIEW (Laboratory Virtual Instrument Engineering Workbench) is a program development environment. It uses the graphical programming language G to create source programs in flow charts instead of using text-based languages to generate source program codes. LabVIEW also integrates all functions such as hardware communications that meet GPIB, VXI, RS-232 and RS-485, and data acquisition cards. It has built-in library functions that facilitate software standards such as TCP/IP and Active X. LabVIEW programs are called virtual instruments (VIs) because their appearance and operation can imitate actual instruments. Even if users do not have much programming experience, they can also use LabVIEW to develop their own applications.
2 System Solution Design
The virtual instrument temperature measurement system uses virtual instrument technology to transform traditional temperature measuring instruments to make them more powerful. The system framework is shown in Figure 1. The instrument system converts the temperature of the object to be measured into analog signals such as voltage or current through the sensor element of the front-end temperature sensing device. After power amplification, filtering and other processing by the signal conditioning circuit, it is converted into a standard voltage signal that can be collected by the data acquisition card. The analog signal is converted into a digital signal in the data acquisition card, and sent to the computer bus under the data acquisition instruction. The collected data is processed in various ways required by the installed virtual instrument software in the PC.

Figure 1 Schematic diagram of the temperature measurement system
The temperature measurement system based on virtual instrument technology consists of two parts: hardware and software.
2.1 Hardware system design
The hardware system consists of a front-end temperature sensing device (temperature sensor), a data acquisition card, a PC system, etc., and mainly realizes functions such as temperature signal acquisition, conversion, and processing.

Figure 2 Schematic diagram of the hardware circuit of the temperature measurement system
The front-end temperature sensing device of this system uses a thermistor. The thermistor RT1 and R1 are connected in series to divide the voltage, and the circuit output voltage is proportional to the temperature. The sensor usually outputs a small signal, and a suitable signal conditioning circuit (such as amplification) must be used to minimize the quantization error. When the temperature increases, the resistance of thermistor RT1 decreases, and a linear voltage is generated at the voltage divider point. After being maintained by the voltage follower, it is amplified by the LM324 in the first and second stages, and a positive linear voltage proportional to the temperature change is output. The analog voltage output by the measurement circuit is sent to the data acquisition card, converted into a digital signal and then input into the PC. 2.2 Software System Design
The software part mainly performs subsequent data processing, alarm, display and other functions, and specifically implements the acquisition card parameter setting, data calibration, real-time display, temperature limit setting, alarm and human-computer interaction functions.
(1) Sensor calibration
Sensor calibration is to establish the relationship between sensor input and output through experiments. Calibration is a verification procedure that must be performed before the instrument is officially used after the design is completed. For the virtual temperature measurement system, calibration is to obtain the functional relationship between voltage and the temperature of the object being measured, so as to calculate the temperature through voltage.
Thermistors have the advantages of high sensitivity, small size, light weight, long service life, and are suitable for long-distance measurement. However, they have large nonlinear errors and slightly poor stability, so calibration is necessary.

By calibrating the system through the curve fitting method, the temperature corresponding to any voltage within the temperature measurement range can be obtained.
(2) Front panel design
The user interface (front panel) is an important part of the virtual instrument. The settings of instrument parameters and the display of test results are all implemented through software. Therefore, the software interface is required to be simple and direct and easy to use. This system uses LabVIEW8.2 software to design the user interface as shown in Figure 3. The interface can display the changes in the voltage waveform obtained by sensor detection, data card acquisition and conversion. At the same time, the temperature value obtained after calibration is displayed in three ways: waveform, pointer and numerical value. It can meet the needs of different users and set the over-limit alarm indication through the Boolean switch.

Figure 3 System front panel (user interface)
(3) Program flowchart design
The source program of LabVIEW is a block diagram and provides a very rich library function, from data acquisition to instrument control, from signal generation to signal processing, from data analysis to graphic display, from file reading and writing to network communication. It is very diverse, which greatly improves the efficiency of user programming and reduces the programming workload. The program flowchart design of this system mainly includes modules such as device initialization, AD component initialization, analog data reading, voltage-temperature conversion, data processing and display, over-limit alarm, AD component release, and device release. Some of these modules directly call submodules (library functions) in LabVIEW, such as multiplication, subtraction, over-limit comparison, timer, etc.; some modules such as Create/Release ID, AD Int/Read/Close are implemented by user-defined design.
See Figure 4 and Figure 5 for specific flow charts and program flowcharts .

Figure 4 System flow chart
Figure 5 Temperature measurement system program flowchart
4 Conclusion
The virtual temperature measurement system is realized by using LabVIEW software, which improves working conditions, improves accuracy, saves time, and reduces costs. The system has strong scalability and can further expand its functions, such as realizing remote temperature measurement and control. The method of constructing a measurement and control system in this system can be extended to similar applications and has very important practical significance. The
innovation of this article is that the temperature measurement system is constructed by using virtual instruments, which realizes the intelligent temperature measurement, high accuracy, low cost, and strong versatility and scalability.
Previous article:Using Virtual Instrumentation and Control to Reduce Measurement Costs
Next article:Automatic testing technology of remote control system based on virtual instrument
- Popular Resources
- Popular amplifiers
Latest Test Measurement Articles
- Keysight Technologies Helps Samsung Electronics Successfully Validate FiRa® 2.0 Safe Distance Measurement Test Case
- From probes to power supplies, Tektronix is leading the way in comprehensive innovation in power electronics testing
- Seizing the Opportunities in the Chinese Application Market: NI's Challenges and Answers
- Tektronix Launches Breakthrough Power Measurement Tools to Accelerate Innovation as Global Electrification Accelerates
- Not all oscilloscopes are created equal: Why ADCs and low noise floor matter
- Enable TekHSI high-speed interface function to accelerate the remote transmission of waveform data
- How to measure the quality of soft start thyristor
- How to use a multimeter to judge whether a soft starter is good or bad
- What are the advantages and disadvantages of non-contact temperature sensors?
MoreSelected Circuit Diagrams
MorePopular Articles
- LED chemical incompatibility test to see which chemicals LEDs can be used with
- Application of ARM9 hardware coprocessor on WinCE embedded motherboard
- What are the key points for selecting rotor flowmeter?
- LM317 high power charger circuit
- A brief analysis of Embest's application and development of embedded medical devices
- Single-phase RC protection circuit
- stm32 PVD programmable voltage monitor
- Introduction and measurement of edge trigger and level trigger of 51 single chip microcomputer
- Improved design of Linux system software shell protection technology
- What to do if the ABB robot protection device stops
MoreDaily News
- Keysight Technologies Helps Samsung Electronics Successfully Validate FiRa® 2.0 Safe Distance Measurement Test Case
- Innovation is not limited to Meizhi, Welling will appear at the 2024 China Home Appliance Technology Conference
- Innovation is not limited to Meizhi, Welling will appear at the 2024 China Home Appliance Technology Conference
- Huawei's Strategic Department Director Gai Gang: The cumulative installed base of open source Euler operating system exceeds 10 million sets
- Download from the Internet--ARM Getting Started Notes
- Learn ARM development(22)
- Learn ARM development(21)
- Learn ARM development(20)
- Learn ARM development(19)
- Learn ARM development(14)
Guess you like
- What is the purpose of the PG pin?
- DC-DC
- Will the power supply problem not allow 32 this year?
- Practical information is here|【TI Embedded Seminar Highlights】The site has added a lot of new content
- When a computer starts the operating system, it loads the system on the disk into the memory and runs it. Does the microcontroller have a similar operating mode?
- Low-pass filter, high-pass filter, integral circuit, differential circuit
- TI C6000 Hardware Architecture Optimization Strategy
- Full of useful information! How to choose a rectifier bridge?
- Design of RFID reader system using MF RC500 reader and AT89S51 microcontroller
- [New Year's Flavor Competition] Northeast New Year's Eve Dinner is Coming

 AMF-3D-020180-53-18P


 京公网安备 11010802033920号