Some non-traditional applications for existing oscilloscopes can allow you to expand the usefulness of this versatile instrument. You paid a lot of money for an oscilloscope, so you should get the most out of it. This article summarizes ten oscilloscope applications that may surprise you. You may find any of them very useful. Today's mid-range oscilloscopes actually have more features than most engineers have ever used. This article summarizes ten oscilloscope applications that may surprise you. You may find any of them very useful. Frequency response testing using the oscilloscope's fast edge functions and math operations Frequency response measurements require a signal source with a flat spectrum. By using the oscilloscope's fast edge test signal as a step signal source and then using the oscilloscope's derivative function, you can get the impulse response of the device under test. Then use the fast Fourier transform (FFT) function to get the frequency response. Figure 1 shows the steps in the process of obtaining the frequency response of the input signal and the frequency response of the 37MHz low-pass filter. 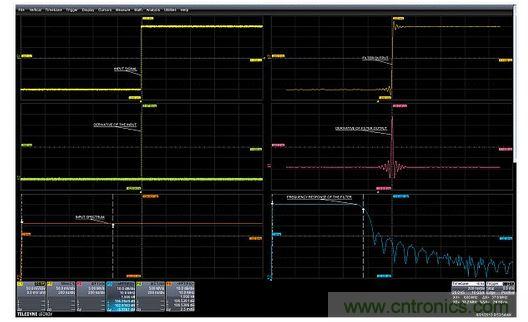
Figure 1: The frequency response of the filter is obtained by applying a fast-edge test signal to the input of the filter (upper left), differentiating it (middle right) with the filter output (upper right trace), and finally taking the FFT average (lower right). The spectrum in the lower left trace shows the frequency flatness of the differentiated step input signal. The fast-edge test signal has a rise time of about 800 ps and a bandwidth of about 400 MHz, which is much larger than the 100 MHz range measured here. High-pass filtering the input signal using the oscilloscope's low-pass digital filter If your oscilloscope can low-pass filter a signal using features such as the enhanced resolution (ERES) math function, you can high-pass filter the same signal. Note that this feature is only available if you have access to the input and output of the digital low-pass filter. Figure 2 shows how this is done. Figure 2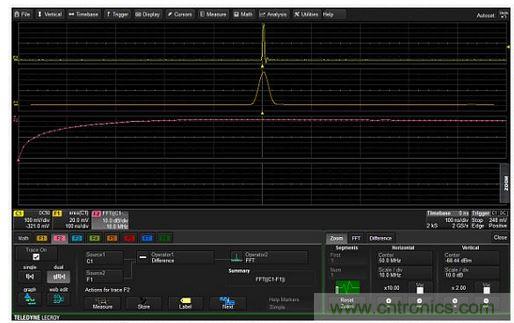
: Subtracting the low-pass filtered waveform (center F1 trace) from the input signal (C1, top trace) creates a signal that has high-pass characteristics, as shown in the spectrum of math trace F2 (bottom trace). The input signal, trace C1, is a very narrow pulse. Math trace F1 (center trace) filters the C1 signal using the oscilloscope's ERES digital filter. Subtracting the filter trace from the input results in a signal with only higher frequency components. Trace F2 performs the subtraction and simultaneously completes the FFT of the high-pass signal so you can see the high-pass characteristics. The frequency where the low-pass response falls to 0.293 of the maximum response is the -3dB point of the high-pass filter. Averaging Only Signals with Certain Shapes or Measurement Parameters Oscilloscopes that provide pass/fail testing based on waveform templates or parametric measurements and store waveforms that meet the pass/fail criteria in memory can selectively include those waveforms in the oscilloscope's averaging function. To enable this feature, first enter the pass/fail criteria based on waveform templates and/or measurement parameters that are within target limits. For a passing test, the waveform is stored in internal memory. The average function is enabled to average the contents of this memory. The result is that only waveforms that meet the test criteria are added to the average. Figure 3 shows such a complete process.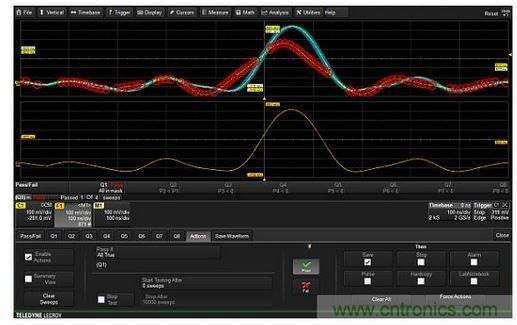
Figure 3: Selectively average only those waveforms that are included in the waveform template. The channel 1 trace (C1) does not match the template, and the red circle indicates the area outside the template. The final accepted trace is stored in memory trace M1, and the entire trace is within the template. The cumulative average trace shown in math trace F1 is an average of only the waveforms that fall within the template. Pass/Fail testing is a test of waveforms that fall completely within the template (shown in blue). Waveforms that meet the pass criteria are stored in memory M1 and added to the average trace in function trace F1. Waveforms that do not meet the criteria are discarded and never appear in the average trace. Find intermittent events by using exclusive triggers to capture only anomalies Intelligent or advanced triggers can trigger on selected waveform characteristics such as width, period, or duty cycle. Several manufacturers also have products that can trigger on intelligent trigger events that are within or outside of the range. This type of trigger is an exclusive trigger, which can be used to trigger only on anomalies, as shown in Figure 4. In this example, the oscilloscope is set to trigger only on pulses with a width greater than 48 ± 0.8ns. This trigger will not fire until a large pulse of 52.6ns width occurs. Because the oscilloscope triggers only on pulses with widths exceeding the nominal value of 48ns, there is no refresh rate issue. It is in a "waiting" state until an abnormal pulse width occurs.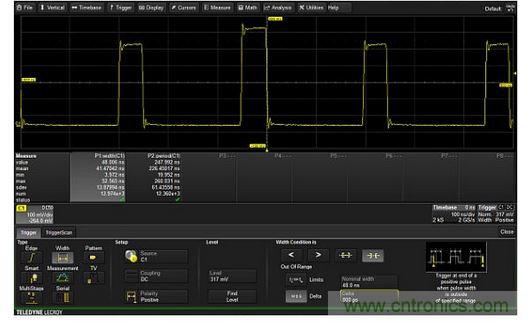
Figure 4: Exclusive trigger that triggers only on pulses with widths exceeding the range of 48±0.8ns. Therefore, the oscilloscope is triggered only on large pulses of 52.6ns, and all normal 48ns width pulses are ignored by the oscilloscope. Using Trend Functions and Trigger Delay as a Self-Timed Data Logger A trend graph is a graphical display of the values of the measured parameters in the order in which they were acquired. Figure 5 is an example of this. In this example, a thermal probe with a sensitivity of 39μV/°C is used to measure the internal temperature of an oscillator. At the same time, the frequency is obtained in a single cycle. The 100 measurements in each trend are obtained from 100 acquisitions. The trigger source is the output of the oscillator. Normally this would cause the oscilloscope to trigger at its nominal refresh rate. To prevent this from happening and to set a known delay between two measurements, the trigger delay function can be used. Using the trigger delay function, the time between acquisitions can be set to 10 seconds, so the total measurement interval is 1000 seconds. The temperature sensor voltage reading is then converted to degrees Celsius using a parameterized math adjustment function.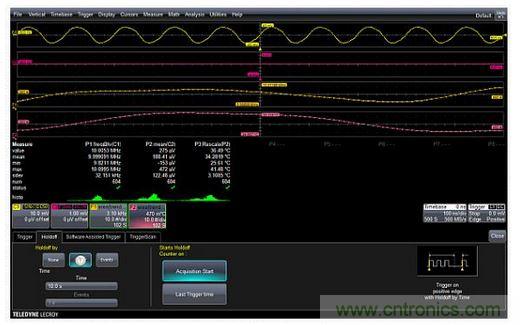
Figure 5: Trend plots of the internal temperature (curve F2) and the oscillator output frequency (curve F1) acquired over a 1000 second period, reflecting the thermal response of the oscillator. Demodulating an Amplitude Modulated Signal The envelope detection method for an amplitude modulated (AM) signal requires peak detection of the signal. Peak detection can be achieved by combining the absolute value math function with a digital low pass filter called Enhanced Resolution (ERES) in this oscilloscope. This makes it very easy to accurately extract the modulation envelope shape. Figure 6 shows an example. The upper left curve is the AM signal to be acquired. The absolute value math function is applied as shown in the lower left curve, providing a full wave rectification effect. Figure 6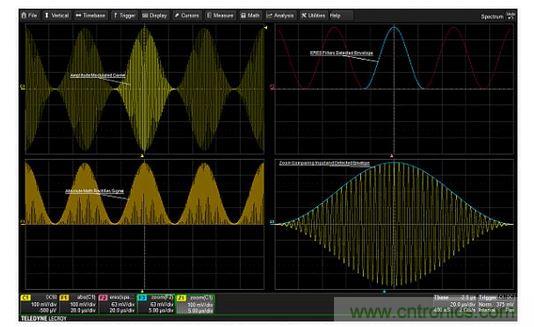
: Steps to extract the modulation envelope from an AM signal. The absolute value is used to "detect" the signal. The ERES filter removes the high frequency carrier, resulting in a clean modulation envelope. The combination of the sparsity and ERES functions is used to low pass filter the absolute value to form the modulation envelope shown in the upper right plot. The sparsity function selectively reduces the sample rate of the acquired waveform, thus helping to set the cutoff frequency of the ERES low pass filter as a function of the sample rate. The cutoff frequency of the low pass filter must be much less than the carrier frequency. The plot in the lower right grid is an overlay zoom of the input AM signal, and the extracted envelope shows the fidelity of the process. The extracted envelope can then be directly measured and further analyzed. Detecting Frequency, Phase, and Pulse Width Modulated Signals Many mid-range oscilloscopes have a trace or time trend function that can generate waveforms based on periodic changes in the timing parameter being measured. The trace function is synchronized in time with the source waveform, so changes in frequency, width, or phase can be easily associated with the source waveform. This provides a method for demodulating frequency modulated (FM), phase modulated (PM), or pulse width modulated (PWM) signals. Figure 7 shows an example of trace demodulation of a phase modulated (PM) waveform using the time interval error (TIE) parameter.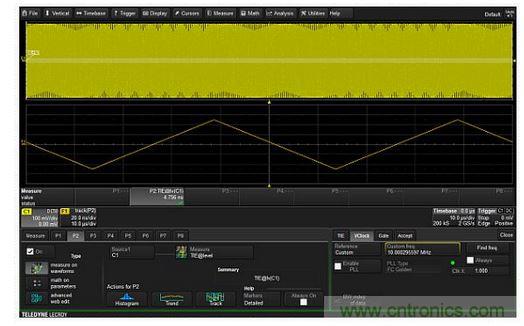
Figure 7: The TIE parameter track can be used to plot the instantaneous phase of each cycle of a PM waveform versus time, thereby enabling demodulation of a phase modulated signal. TIE is the time difference between crossing a threshold in a waveform and crossing the threshold at an ideal location. In effect, it is the instantaneous phase of the signal. The TIE track therefore shows the periodic variation of the carrier phase and can be used to generate waveforms whose phase variations are synchronized in time with the original modulating carrier. The vertical scale in the figure is in units of time and can be easily converted to phase by a simple adjustment. Similarly, the frequency parameter track can show the modulated signal of an FM carrier and the pulse width track can produce PWM demodulation. Adding a "Max Hold" Function to an Oscilloscope's Fast Fourier Transform The peak or "maximum" hold function provided by a spectrum analyzer is very useful when making swept sine frequency response measurements. Most oscilloscopes do not provide this function in their FFTs, but they do provide a peak or maximum math function that, in conjunction with the FFT, holds the maximum amplitude occurring at each frequency bin in the FFT. Figure 8 provides an example of this function.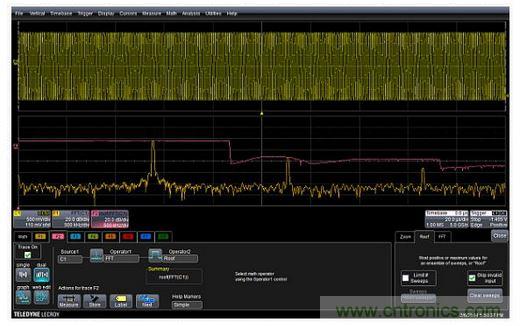
Figure 8: The red trace F2 (center) shows the peak or maximum value at each frequency in the FFT of a swept sine wave. Trace F1 (bottom) is an FFT without the highest or maximum value applied. The F2 descriptor box shows the setting for the highest function. As the input sine wave is swept across the frequency range, the highest (or maximum) function shown in trace F2 will maintain the peak amplitude at each frequency bin in the FFT, thus allowing the user to see the maximum response at each frequency bin. Calculating Power Spectral Density of a Waveform in V2/Hz The oscilloscope FFT displays the power spectrum and power spectral density (PSD) in logarithmic units of dBm and dBm/Hz, respectively. However, applications such as noise analysis require power spectral density in linear units such as V2/Hz or V/√Hz. Linear scale power spectral density measurements can be made by using a small number of FFTs and rescaling math functions. Figure 9 shows the FFT settings for this measurement. The FFT output type is set to squared magnitude to display the FFT in vertical units of V2. Conversion to power spectral density requires that the FFT be normalized to the effective resolution bandwidth of the FFT, which is the product of the resolution bandwidth (Δf) and the effective noise bandwidth ENBW of the selected weighting function, as reported in Figure 9 for the FFT settings.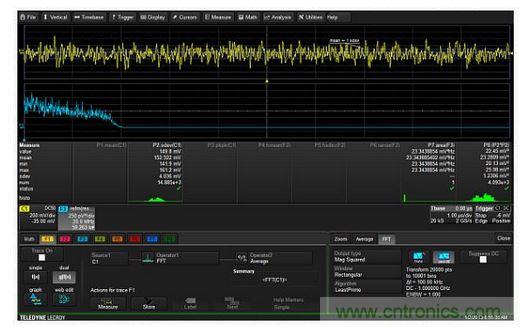
Figure 9: Trace C1 is the captured band-limited noise signal. Trace F3 is the power spectral density with a linear vertical scale in V2/Hz. Parameter P7 reads the area under the power spectral density curve and compares it to the mean square value of the time waveform, which is calculated as the squared standard deviation of Trace C1 in Parameter P8. This oscilloscope reads the FFT as a peak value, so we must also convert this value back to a mean square value, which means dividing all amplitude values by 2. Normalization is done with the rescale math function, which in this case multiplies each FFT amplitude value by 5×10⁻⁶. The resulting curve is shown in Figure 9, F3, with the power spectral density read in V2/Hz. Parameter P2 is the standard deviation of the input waveform C1. This value is squared in Parameter P8 and is the mean square amplitude of the input signal. Parameter P7 reads the area under the power spectral density curve (F3) as 23.3mV2. It also reports the mean square amplitude - in this case 23.28mV2 from the FFT, to confirm this process. Comparing Spectral Components Using Zoomed Gated FFTs Occasionally you may need to perform an FFT on a small portion of a captured waveform. This usually occurs when the waveform in question varies in time. Most oscilloscopes allow you to gate the FFT process either by using the gating function in the FFT controls or by calculating the FFT on a zoom of the captured waveform. Keep in mind that in either case, the FFT resolution bandwidth will be determined as the inverse of the duration of the gated signal. Since the gated portion is shorter than the entire waveform, the resolution bandwidth will increase and the FFT frequency resolution will decrease. Figure 10 shows an example of a gated FFT analysis of a linear sine sweep waveform. The frequency of the sine wave varies from 1 MHz to 80 MHz over a 10 ms sweep duration (trace M1, upper left). Two 5 μs zoomed waveforms were acquired at 437 μs and 1.42 ms (trace Z1, center left, and Z2, lower left). The FFT of the entire waveform (F1, upper right) shows uniform amplitude over the entire sweep range. The FFTs of Z1 and Z2 show the frequency at selected points in time during the sweep.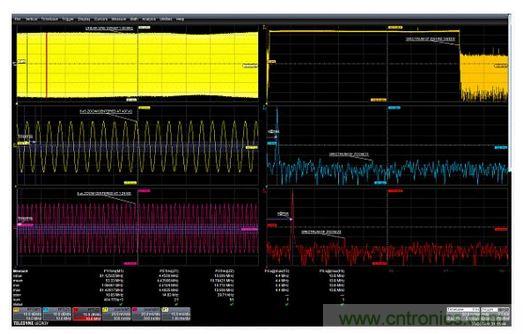
Figure 10: Example of using the zoom function to gate an FFT. Two 5μs zoomed waveforms acquired at 437μs and 1.42ms show the difference in frequency as a function of time. Summary Some nontraditional applications for your existing oscilloscope can allow you to expand the usefulness of this versatile instrument. You paid a lot of money for your oscilloscope, and you should get the most out of it. Fortunately, these tips can help you do just that.
Keywords:Oscilloscope
Reference address:10 ways to expand the use of your oscilloscope

Figure 1: The frequency response of the filter is obtained by applying a fast-edge test signal to the input of the filter (upper left), differentiating it (middle right) with the filter output (upper right trace), and finally taking the FFT average (lower right). The spectrum in the lower left trace shows the frequency flatness of the differentiated step input signal. The fast-edge test signal has a rise time of about 800 ps and a bandwidth of about 400 MHz, which is much larger than the 100 MHz range measured here. High-pass filtering the input signal using the oscilloscope's low-pass digital filter If your oscilloscope can low-pass filter a signal using features such as the enhanced resolution (ERES) math function, you can high-pass filter the same signal. Note that this feature is only available if you have access to the input and output of the digital low-pass filter. Figure 2 shows how this is done. Figure 2

: Subtracting the low-pass filtered waveform (center F1 trace) from the input signal (C1, top trace) creates a signal that has high-pass characteristics, as shown in the spectrum of math trace F2 (bottom trace). The input signal, trace C1, is a very narrow pulse. Math trace F1 (center trace) filters the C1 signal using the oscilloscope's ERES digital filter. Subtracting the filter trace from the input results in a signal with only higher frequency components. Trace F2 performs the subtraction and simultaneously completes the FFT of the high-pass signal so you can see the high-pass characteristics. The frequency where the low-pass response falls to 0.293 of the maximum response is the -3dB point of the high-pass filter. Averaging Only Signals with Certain Shapes or Measurement Parameters Oscilloscopes that provide pass/fail testing based on waveform templates or parametric measurements and store waveforms that meet the pass/fail criteria in memory can selectively include those waveforms in the oscilloscope's averaging function. To enable this feature, first enter the pass/fail criteria based on waveform templates and/or measurement parameters that are within target limits. For a passing test, the waveform is stored in internal memory. The average function is enabled to average the contents of this memory. The result is that only waveforms that meet the test criteria are added to the average. Figure 3 shows such a complete process.

Figure 3: Selectively average only those waveforms that are included in the waveform template. The channel 1 trace (C1) does not match the template, and the red circle indicates the area outside the template. The final accepted trace is stored in memory trace M1, and the entire trace is within the template. The cumulative average trace shown in math trace F1 is an average of only the waveforms that fall within the template. Pass/Fail testing is a test of waveforms that fall completely within the template (shown in blue). Waveforms that meet the pass criteria are stored in memory M1 and added to the average trace in function trace F1. Waveforms that do not meet the criteria are discarded and never appear in the average trace. Find intermittent events by using exclusive triggers to capture only anomalies Intelligent or advanced triggers can trigger on selected waveform characteristics such as width, period, or duty cycle. Several manufacturers also have products that can trigger on intelligent trigger events that are within or outside of the range. This type of trigger is an exclusive trigger, which can be used to trigger only on anomalies, as shown in Figure 4. In this example, the oscilloscope is set to trigger only on pulses with a width greater than 48 ± 0.8ns. This trigger will not fire until a large pulse of 52.6ns width occurs. Because the oscilloscope triggers only on pulses with widths exceeding the nominal value of 48ns, there is no refresh rate issue. It is in a "waiting" state until an abnormal pulse width occurs.

Figure 4: Exclusive trigger that triggers only on pulses with widths exceeding the range of 48±0.8ns. Therefore, the oscilloscope is triggered only on large pulses of 52.6ns, and all normal 48ns width pulses are ignored by the oscilloscope. Using Trend Functions and Trigger Delay as a Self-Timed Data Logger A trend graph is a graphical display of the values of the measured parameters in the order in which they were acquired. Figure 5 is an example of this. In this example, a thermal probe with a sensitivity of 39μV/°C is used to measure the internal temperature of an oscillator. At the same time, the frequency is obtained in a single cycle. The 100 measurements in each trend are obtained from 100 acquisitions. The trigger source is the output of the oscillator. Normally this would cause the oscilloscope to trigger at its nominal refresh rate. To prevent this from happening and to set a known delay between two measurements, the trigger delay function can be used. Using the trigger delay function, the time between acquisitions can be set to 10 seconds, so the total measurement interval is 1000 seconds. The temperature sensor voltage reading is then converted to degrees Celsius using a parameterized math adjustment function.

Figure 5: Trend plots of the internal temperature (curve F2) and the oscillator output frequency (curve F1) acquired over a 1000 second period, reflecting the thermal response of the oscillator. Demodulating an Amplitude Modulated Signal The envelope detection method for an amplitude modulated (AM) signal requires peak detection of the signal. Peak detection can be achieved by combining the absolute value math function with a digital low pass filter called Enhanced Resolution (ERES) in this oscilloscope. This makes it very easy to accurately extract the modulation envelope shape. Figure 6 shows an example. The upper left curve is the AM signal to be acquired. The absolute value math function is applied as shown in the lower left curve, providing a full wave rectification effect. Figure 6

: Steps to extract the modulation envelope from an AM signal. The absolute value is used to "detect" the signal. The ERES filter removes the high frequency carrier, resulting in a clean modulation envelope. The combination of the sparsity and ERES functions is used to low pass filter the absolute value to form the modulation envelope shown in the upper right plot. The sparsity function selectively reduces the sample rate of the acquired waveform, thus helping to set the cutoff frequency of the ERES low pass filter as a function of the sample rate. The cutoff frequency of the low pass filter must be much less than the carrier frequency. The plot in the lower right grid is an overlay zoom of the input AM signal, and the extracted envelope shows the fidelity of the process. The extracted envelope can then be directly measured and further analyzed. Detecting Frequency, Phase, and Pulse Width Modulated Signals Many mid-range oscilloscopes have a trace or time trend function that can generate waveforms based on periodic changes in the timing parameter being measured. The trace function is synchronized in time with the source waveform, so changes in frequency, width, or phase can be easily associated with the source waveform. This provides a method for demodulating frequency modulated (FM), phase modulated (PM), or pulse width modulated (PWM) signals. Figure 7 shows an example of trace demodulation of a phase modulated (PM) waveform using the time interval error (TIE) parameter.

Figure 7: The TIE parameter track can be used to plot the instantaneous phase of each cycle of a PM waveform versus time, thereby enabling demodulation of a phase modulated signal. TIE is the time difference between crossing a threshold in a waveform and crossing the threshold at an ideal location. In effect, it is the instantaneous phase of the signal. The TIE track therefore shows the periodic variation of the carrier phase and can be used to generate waveforms whose phase variations are synchronized in time with the original modulating carrier. The vertical scale in the figure is in units of time and can be easily converted to phase by a simple adjustment. Similarly, the frequency parameter track can show the modulated signal of an FM carrier and the pulse width track can produce PWM demodulation. Adding a "Max Hold" Function to an Oscilloscope's Fast Fourier Transform The peak or "maximum" hold function provided by a spectrum analyzer is very useful when making swept sine frequency response measurements. Most oscilloscopes do not provide this function in their FFTs, but they do provide a peak or maximum math function that, in conjunction with the FFT, holds the maximum amplitude occurring at each frequency bin in the FFT. Figure 8 provides an example of this function.

Figure 8: The red trace F2 (center) shows the peak or maximum value at each frequency in the FFT of a swept sine wave. Trace F1 (bottom) is an FFT without the highest or maximum value applied. The F2 descriptor box shows the setting for the highest function. As the input sine wave is swept across the frequency range, the highest (or maximum) function shown in trace F2 will maintain the peak amplitude at each frequency bin in the FFT, thus allowing the user to see the maximum response at each frequency bin. Calculating Power Spectral Density of a Waveform in V2/Hz The oscilloscope FFT displays the power spectrum and power spectral density (PSD) in logarithmic units of dBm and dBm/Hz, respectively. However, applications such as noise analysis require power spectral density in linear units such as V2/Hz or V/√Hz. Linear scale power spectral density measurements can be made by using a small number of FFTs and rescaling math functions. Figure 9 shows the FFT settings for this measurement. The FFT output type is set to squared magnitude to display the FFT in vertical units of V2. Conversion to power spectral density requires that the FFT be normalized to the effective resolution bandwidth of the FFT, which is the product of the resolution bandwidth (Δf) and the effective noise bandwidth ENBW of the selected weighting function, as reported in Figure 9 for the FFT settings.

Figure 9: Trace C1 is the captured band-limited noise signal. Trace F3 is the power spectral density with a linear vertical scale in V2/Hz. Parameter P7 reads the area under the power spectral density curve and compares it to the mean square value of the time waveform, which is calculated as the squared standard deviation of Trace C1 in Parameter P8. This oscilloscope reads the FFT as a peak value, so we must also convert this value back to a mean square value, which means dividing all amplitude values by 2. Normalization is done with the rescale math function, which in this case multiplies each FFT amplitude value by 5×10⁻⁶. The resulting curve is shown in Figure 9, F3, with the power spectral density read in V2/Hz. Parameter P2 is the standard deviation of the input waveform C1. This value is squared in Parameter P8 and is the mean square amplitude of the input signal. Parameter P7 reads the area under the power spectral density curve (F3) as 23.3mV2. It also reports the mean square amplitude - in this case 23.28mV2 from the FFT, to confirm this process. Comparing Spectral Components Using Zoomed Gated FFTs Occasionally you may need to perform an FFT on a small portion of a captured waveform. This usually occurs when the waveform in question varies in time. Most oscilloscopes allow you to gate the FFT process either by using the gating function in the FFT controls or by calculating the FFT on a zoom of the captured waveform. Keep in mind that in either case, the FFT resolution bandwidth will be determined as the inverse of the duration of the gated signal. Since the gated portion is shorter than the entire waveform, the resolution bandwidth will increase and the FFT frequency resolution will decrease. Figure 10 shows an example of a gated FFT analysis of a linear sine sweep waveform. The frequency of the sine wave varies from 1 MHz to 80 MHz over a 10 ms sweep duration (trace M1, upper left). Two 5 μs zoomed waveforms were acquired at 437 μs and 1.42 ms (trace Z1, center left, and Z2, lower left). The FFT of the entire waveform (F1, upper right) shows uniform amplitude over the entire sweep range. The FFTs of Z1 and Z2 show the frequency at selected points in time during the sweep.

Figure 10: Example of using the zoom function to gate an FFT. Two 5μs zoomed waveforms acquired at 437μs and 1.42ms show the difference in frequency as a function of time. Summary Some nontraditional applications for your existing oscilloscope can allow you to expand the usefulness of this versatile instrument. You paid a lot of money for your oscilloscope, and you should get the most out of it. Fortunately, these tips can help you do just that.
Previous article:Engineers must learn: How to use an oscilloscope to debug power supply firmware
Next article:12 Oscilloscope Features You Might Not Know
Recommended Content
Latest Test Measurement Articles
- Keysight Technologies Helps Samsung Electronics Successfully Validate FiRa® 2.0 Safe Distance Measurement Test Case
- From probes to power supplies, Tektronix is leading the way in comprehensive innovation in power electronics testing
- Seizing the Opportunities in the Chinese Application Market: NI's Challenges and Answers
- Tektronix Launches Breakthrough Power Measurement Tools to Accelerate Innovation as Global Electrification Accelerates
- Not all oscilloscopes are created equal: Why ADCs and low noise floor matter
- Enable TekHSI high-speed interface function to accelerate the remote transmission of waveform data
- How to measure the quality of soft start thyristor
- How to use a multimeter to judge whether a soft starter is good or bad
- What are the advantages and disadvantages of non-contact temperature sensors?
MoreSelected Circuit Diagrams
MorePopular Articles
- Innolux's intelligent steer-by-wire solution makes cars smarter and safer
- 8051 MCU - Parity Check
- How to efficiently balance the sensitivity of tactile sensing interfaces
- What should I do if the servo motor shakes? What causes the servo motor to shake quickly?
- 【Brushless Motor】Analysis of three-phase BLDC motor and sharing of two popular development boards
- Midea Industrial Technology's subsidiaries Clou Electronics and Hekang New Energy jointly appeared at the Munich Battery Energy Storage Exhibition and Solar Energy Exhibition
- Guoxin Sichen | Application of ferroelectric memory PB85RS2MC in power battery management, with a capacity of 2M
- Analysis of common faults of frequency converter
- In a head-on competition with Qualcomm, what kind of cockpit products has Intel come up with?
- Dalian Rongke's all-vanadium liquid flow battery energy storage equipment industrialization project has entered the sprint stage before production
MoreDaily News
- Allegro MicroSystems Introduces Advanced Magnetic and Inductive Position Sensing Solutions at Electronica 2024
- Car key in the left hand, liveness detection radar in the right hand, UWB is imperative for cars!
- After a decade of rapid development, domestic CIS has entered the market
- Aegis Dagger Battery + Thor EM-i Super Hybrid, Geely New Energy has thrown out two "king bombs"
- A brief discussion on functional safety - fault, error, and failure
- In the smart car 2.0 cycle, these core industry chains are facing major opportunities!
- The United States and Japan are developing new batteries. CATL faces challenges? How should China's new energy battery industry respond?
- Murata launches high-precision 6-axis inertial sensor for automobiles
- Ford patents pre-charge alarm to help save costs and respond to emergencies
- New real-time microcontroller system from Texas Instruments enables smarter processing in automotive and industrial applications
Guess you like
- Application of electromagnetic functional composite materials in radar antenna covers
- Noise Countermeasures Using Capacitors
- I have a few questions about the WM8978 audio amplifier board.
- Guess what development board this is?
- ST programmable sensor + FSM on Unico
- Digital Circuits and Digital Systems: Experiments and Course Design Training Course
- AT91SAM7S256 serial port data loss
- Using DSP motor speed measurement and detailed explanation
- Low-power Qorvo chips enhance connectivity and reliability for new Luna smart home system
- Highlights of Bluetooth Mesh Technology

 Signal Integrity and Power Integrity Analysis (Eric Bogatin)


 京公网安备 11010802033920号