Overview
RF technology is everywhere. Even as an ordinary consumer, you are affected by it every moment, not to mention an RF test engineer. The cost of wireless devices has been greatly reduced, which can make spare time easier, but it will bring more challenges when designing the next generation of RF automatic test systems. The challenge of reducing test costs faced by engineering projects is more severe than ever before. Therefore, the focus of current automatic test systems is to reduce the overall test time.
Instrument A is Rhode & Schwartz FSG
Table 1. Comparison of PXI and traditional instrumentation.

Keywords:RF
Reference address:RF WCDMA Benchmark Comparison Test White Paper
By comparing with traditional instruments, we can understand the speed advantage of software-defined PXI RF instruments. As shown in the WCDMA measurement results, the LabVIEW measurement algorithm based on multi-core processor parallel execution can achieve significant speed improvement compared with traditional instruments.
introduce
You wake up at 7:00 a.m. to the sound of rock music, and the RDS receiver in the radio alarm clock reminds you that you are listening to Welcome to the Jungle from the band Guns N' Roses. Then, while you sip your coffee, you can check your emails through the WLAN receiver in the study. When you are ready for work, you walk out the door and use a 315MHz FSK transmitter to unlock the car. Sit in the car and drive on the road. You can enjoy the commercial-free entertainment provided by the radio again. Later, you will establish a connection with the 3G mobile phone in the car through the Bluetooth headset. In a few minutes, the onboard GPS navigator can correct your current 3D position and indicate the route. The voice of the GPS receiver reminds you that you need to enter the toll road, and the RFID receiver will automatically collect the corresponding toll.
RF technology is everywhere. Even as an ordinary consumer, you are affected by it every moment, not to mention an RF test engineer. The cost of wireless devices has been greatly reduced, which can make spare time easier, but it will bring more challenges when designing the next generation of RF automatic test systems. The challenge of reducing test costs faced by engineering projects is more severe than ever before. Therefore, the focus of current automatic test systems is to reduce the overall test time.
Newly released 6.6GHz RF test platform
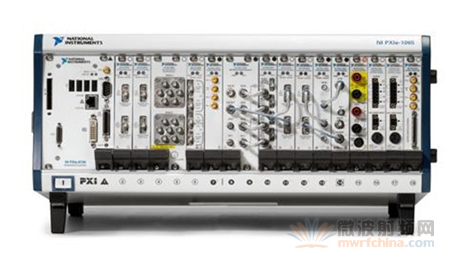
To meet this demand, NI has developed a 6.6GHz high-speed RF test platform. The new products released include the NI PXIe-5663 vector signal analyzer and the NI PXIe-5673 vector signal generator, which can provide high-speed and flexible solutions for automated RF testing. The NI PXIe-5663 can analyze 10 MHz to 6.6 GHz signals with an instantaneous bandwidth of 50 MHz. The NI PXIe-5673 can generate 85 MHz to 6.6 GHz signals with an instantaneous bandwidth of 100 MHz.

Figure 1. PXI system based on the latest 6.6GHz RF test platform.
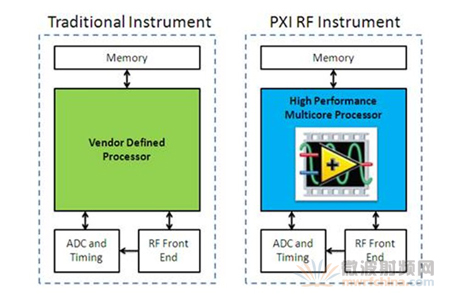
The 6.6GHz RF test platform is ideal for automated test applications. Using highly parallel NI LabVIEW measurement algorithms, PXI modular instruments can achieve significantly faster measurement speeds than traditional instruments. To understand why PXI modular instruments can achieve faster measurement speeds than traditional instruments, the difference between the two architectures can be found. Although the two use similar components, the difference is that PXI systems use high-performance multi-core central processing units (CPUs). Figure 2 shows the system block diagram of the two types of instruments, which can illustrate this difference.

Figure 2. A user-defined CPU is the core component of PXI RF instrumentation.
While PXI and traditional instrumentation have many similarities, the user-defined multi-core CPUs in PXI modular instruments can achieve faster measurement speeds. In many cases, RF measurement algorithms are also written in a parallel manner native to the LabVIEW programming language. Therefore, overall measurement speed can be improved by upgrading the CPU to multiple cores. As CPU clock rates (or the number of CPU cores) increase in accordance with Moore's Law, current RF test instruments can achieve very fast speeds. As you will see in this article, many PXI vector signal analyzers can be up to 30 times faster than traditional benchtop vector signal analyzers for some of the more processor-intensive RF measurement algorithms.
To further understand the advantages of PXI instruments, some high-throughput wireless test applications can be analyzed. In this case, test time accounts for a large proportion of the cost of goods sold (COGS). In addition, for wireless communication protocols such as 3G UMTS (WCDMA), processor-intensive algorithms will take up a lot of processor resources. To address this problem, AmFax, a National Instruments system alliance partner, provides highly parallel measurement algorithms for WCDMA physical layer testing. NI RF instruments and partner software have achieved a low-cost, high-speed, and high-precision test platform.
AmFax Uses LabVIEW to Achieve Faster WCDMA Measurements
To demonstrate the measurement speed and accuracy of the PXIe-5663 RF vector signal analyzer, we conducted a head-to-head competition with an industry-leading traditional instrument (see Table 1). Both traditional instruments used in the comparison test are relatively new RF vector signal analyzers (VSAs) and are much more expensive than a complete PXIe-5663 RF test system.
|
|
Instrument A1
|
Instrument B2
|
PXIe-5663
|
|
Instrument Type
|
Traditional RF VSA
|
Traditional RF VSA
|
PXI Express RF VSA
|
|
Frequency Range
|
9 kHz to 8 GHz
|
1 MHz to 8 GHz
|
10 MHz to 6.6 GHz
|
Instrument A is Rhode & Schwartz FSG
Instrument B is Rhode & Schwartz FSQ
Table 1. Comparison of PXI and traditional instrumentation.
To provide more realistic benchmark data, the measurement times of PXI and traditional instruments are compared across a range of communication standard measurement applications. For WCDMA applications, the performance of the instrument is evaluated across a range of parameter measurements. Physical layer tests typically require long acquisition times, such as the Complementary Cumulative Distribution Function (CCDF), and the final test time is not very related to the processor speed performance. For some tests that require demodulation operations, such as Error vector magnitude (EVM), a lot of data processing is required. Finally, frequency domain measurements are also performed, such as adjacent channel leakage power ratio (ACLR) and occupied bandwidth (OBW), which usually require discrete Fourier transform (DFT) operations.
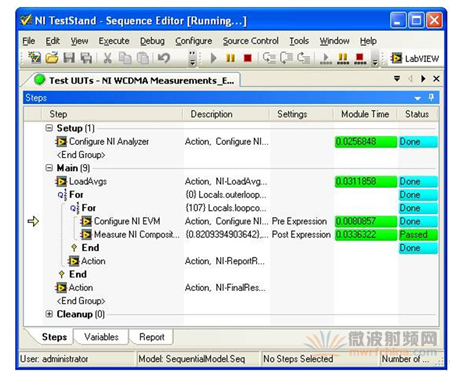
In a common test execution framework, such as NI TestStand software, you can quickly configure an automated test sequence. NI TestStand software not only provides a built-in framework for serialized testing, but also allows statistics on the time spent on each test. As shown in Figure 3, this is a screenshot of the NI TestStand interface for test time statistics in an automated test sequence.

Figure 3. NI TestStand automates product testing.
As shown in Figure 3, observe the steps of the EVM test in the nested For Loops ("NI Configure EVM", "NI Measure EVM"). The outer For Loop is used to determine the number of times to average a given measurement, and the inner For Loop is used to measure multiple times in the same configuration. Multiple measurements taken in the same configuration can be used for statistical analysis to determine the mean and standard deviation.
Configuring RF Instruments
When benchmarking instruments, it is important to set each instrument to its fastest speed. For legacy instruments, the fastest speed is achieved by using the onboard averaging function rather than manually averaging each measurement. In addition, the front panel display should be turned off while the test is running. Finally, it is important to choose an efficient instrument control bus. Because this test generates small blocks of data, the selected data bus must have low latency. Therefore, we chose the GPIB bus over the LAN to ensure minimal latency. In fact, as a general rule, when averaging is not used or is used less frequently, latency has a more significant impact on the measurement.
In order to benchmark the measurement speed of the RF vector signal analyzer, an RF vector signal generator is needed to provide a signal source for loopback testing. To evaluate the performance of the PXIe-5663 VSA, the latest PXIe-5667 6.6 GHz RF vector signal generator can be used to generate the source signal. This source signal complies with the WCDMA standard and has a center frequency of 1.95 GHz. The RF output power is set to -10 dBm and the output port of the signal generator is directly connected to the input port of the analyzer. Figure 4 shows the hardware configuration.

Figure 4. Directly connect the VSA and VSG.
Although using an actual instrument as the device under test (DUT) is more suitable for characterization testing (such as repeatability testing), the benefit of loopback testing is that it can demonstrate the measurement performance of the instrument.
Measurement time statistics
Observe the measurement time (in seconds) for each measurement using the above configurations. Note that the number of averages used for the measurements in Table 2 is based on the number of averages commonly used in design verification. Below, you can learn more about the relationship between the number of averages and measurement repeatability.
Typical measurement times for various measurement applications
|
The time is in seconds
|
Average number of times
|
Instrument A
|
Instrument B
|
NI PXI-5663 w/NI PXIe-8130
|
NI PXIe-5663 w/NI PXIe-8106
|
NI PXI-5663 w/NI 8353
|
|
CCDF
|
1M
|
0.505
|
0.510
|
0.488
|
0.330
|
0.384
|
|
EVM measurement time
|
20
|
3.142
|
3.130
|
0.822
|
0.577
|
0.519
|
|
ACLR measurement time
|
20
|
3.070
|
3.100
|
0.200
|
0.174
|
0.168
|
|
OBW measurement time
|
20
|
4.554
|
4.540
|
0.217
|
0.188
|
0.167
|
|
total time
|
|
11.270
|
11.280
|
1.727
|
1.269
|
1.070
|
|
Speed improvement compared to instrument A
|
|
1 times
|
1 times
|
6.56 times
faster |
8.88 times
faster |
10.53 times
faster |
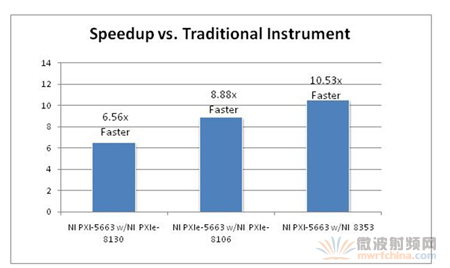
Table 2. WCDMA measurement times for traditional and PXI instruments.
As shown in Table 2, the PXIe-5663 RF vector signal analyzer can achieve measurement speeds far exceeding those of traditional instruments, whether using an embedded controller or a rack-mount controller. In addition, the impact of processor speed on the overall measurement time can be seen. The NI PXIe-8130 embedded controller uses an AMD Turon X2 2.3 GHz CPU, the NI PXIe-8106 uses a 2.16 GHz Intel Core 2 Duo CPU, and the quad-core NI 8353 1U rack-mount controller uses two 2.4 GHz Core 2 Duo CPUs. Since the performance of the CPU directly determines the speed of the measurement, the quad-core controller can achieve faster measurement speeds than the fastest dual-core controller. Figure 5 shows the overall measurement time reduction achieved compared to traditional instruments in percentage form.

Figure 5. The NI 8353 1U controller can reduce measurement time by 83% compared to traditional instruments.
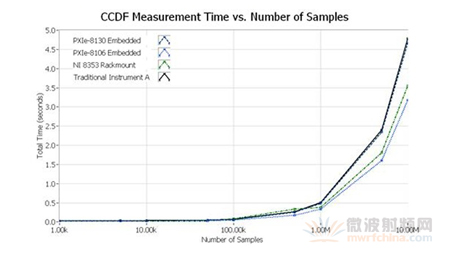
For most WCDMA physical layer measurements, the processing time of the measured values has the greatest impact on the overall measurement time. For these measurements, the overall measurement time is usually related to the number of averages performed. However, there is an exception, which is the CCDF measurement that requires a particularly large amount of data acquisition. In this case, the performance of the processor has less impact on the overall measurement time. Figure 6 shows a CCDF measurement, where you can see that the PXI measurement system is slightly faster than the traditional instrument.

Figure 6. The number of averaging operations has little effect on CCDF measurement time.
To more fully and accurately see the performance gains from PXI instrumentation, these measurements need to be taken several times. All data shown below is the average of 10 measurements in each configuration. As shown in Figure 6, CCDF measurement time can be reduced by 33% using a PXI-based measurement system instead of traditional instrumentation. Here, you can see that the NI 8353 quad-core rack-mount controller achieves the highest measurement speed.
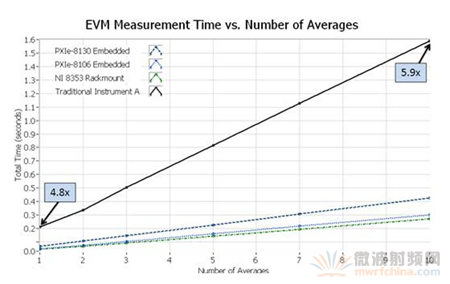
For processor-intensive physical layer measurements, the choice of processor can have a significant impact on the overall measurement time. In Figures 7 to 9, you can see the relationship between measurement time and average times for traditional and PXI instruments.

Figure 7. PXI instruments offer the greatest speed advantage in processor-intensive measurements.
For processor-intensive applications such as EVM measurements, the choice of processor can have a significant impact on the overall measurement time. For example, an EVM measurement set to average five points takes 342 milliseconds using a PXIe-8130 embedded dual-core controller, but takes 33% less time to 228 milliseconds using an NI 8353 quad-core controller. Similar results can be seen in the adjacent channel leakage ratio (ACLR) measurement, as shown in Figure 8.

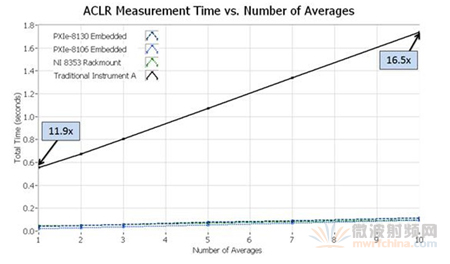
Figure 8. Measurement time versus number of averages in ACLR measurements.
In ACLR measurements, the PXI RF measurement system can be 16 times faster than traditional instruments. For an ACLR measurement (not considering the time required for configuration), the typical test time is less than 8 milliseconds, which is shorter than the conventional time domain ACLR measurement time. Figure 9 shows the last measurement result, which is the occupied bandwidth measurement.

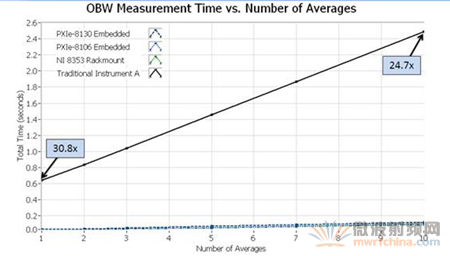
Figure 9. Occupied bandwidth measurements can be made 30 times faster using PXI instruments than traditional instruments.
In Figure 9 you can see that for some measurements, PXI RF instruments can achieve the same measurement results 30 times faster than traditional instruments. In addition, for some measurements that require more averaging, the absolute measurement time advantage of PXI instruments is even more significant.
Measurement Averaging and Repeatability
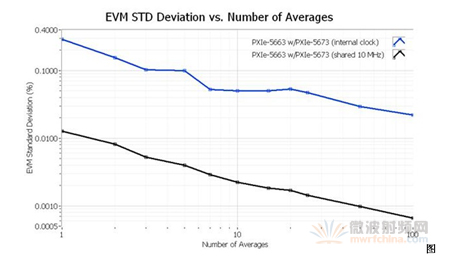
Although averaging has a significant impact on the overall measurement time, it is still necessary to achieve repeatable measurement results. Since averaging the measured values actually increases the overall measurement time, it is important to understand the relationship between the number of averages and repeatability. Because averaging can reduce some of the noise in the signal, you can see that as the number of averages increases, the repeatability of consecutive runs improves. Figure 10 shows the EVM standard deviation for different configurations of the number of averages.

Figure 10. EVM standard deviation at different average operation times.
As shown in Figure 10, all EVM measurements are made within one WCDMA frame, which is equivalent to 2600 chips. Please observe the relationship between the measurement repeatability accuracy and the number of averages. Only 1000 sets of data are used in the results shown in Figure 10, but for most product test applications, a larger data set is usually required. In fact, many tests use multiple instruments, so a more accurate model is needed to characterize the measurement repeatability.
Using the PXIe-5663 RF vector signal analyzer and the PXIe-5673 vector signal generator, you can easily achieve EVM measurements better than 1%. Table 3 shows the mean and standard deviation achieved with a heavier configuration.
|
Collection points
|
Average number of times
|
EVM mean
|
Standard Deviation
|
|
1000
|
1
|
0.82343%
|
0.01276%
|
|
1000
|
5
|
0.82171%
|
0.00398%
|
|
1000
|
10
|
0.82076%
|
0.00225%
|
|
1000
|
25
|
0.82055%
|
0.00143%
|
|
1000
|
50
|
0.82056%
|
0.00098%
|
|
1000
|
100
|
0.82063%
|
0.00066%
|
Table 3. EVM and standard deviation for different averaging times.
The NI 5663 RF vector signal analyzer and PXIe-5673 RF signal generator can achieve accurate and repeatable EVM measurements for WCDMA standards.
in conclusion
As wireless communication becomes more widespread, the need to reduce its measurement time becomes increasingly challenging. Fortunately, PXI measurement systems can take advantage of the latest advances in computing. In fact, as the data in this article shows, parallel measurement algorithms executed on multicore PXI processors have significant speed advantages over similar algorithms on traditional instruments. Therefore, with the new PXI 6.6 GHz RF measurement platform from National Instruments, you can meet new challenges in RF test while reducing test costs.
Previous article:Input Impedance Measurement of High-Speed Analog-to-Digital Converters Based on Network Division
Next article:Test platform solution for effective characterization of amplifier interference sensitivity
Recommended ReadingLatest update time:2024-11-22 12:38
LED lighting control system based on RF4CE

The intelligent lighting system designed in this scheme can set the desired light intensity, color temperature and special lighting effects through the human-machine interface. When the remote control sends the control requirements to each LED dimmer, the dimmer can automatically complete the regulation of the LED w
[Power Management]

ATE Promotes WiMAX RF Testing and Characterization

introduction
ATE promotes WiMAX RF testing and characterization. WiMAX transceiver devices have proven to be beneficial to the development of the consumer electronics market, where they have found many uses, including connecting WiFi hotspots to the Internet. To ensure that the devices work as expected and get t
[Test Measurement]

Introduction to Designing RF Instruments with LabVIEW FPGA and Software

Overview The number of wireless devices, the diversity of communication standards, and the complexity of modulation schemes continue to increase every year. With the birth of each new generation of technology, the cost of testing wireless devices using traditional technology requires a large amount of more complex t
[Test Measurement]

RF transceiver using ET technology reduces RF circuit power consumption
In order to improve the battery life of smartphones, in addition to improving the quality of components such as processors and panels, working on radio frequency (RF) circuits is also a way. Japanese print media "Nikkei Electronics" pointed out that since RF circuits consume a maximum of about 2 watts of power, many c
[Power Management]
Bluetooth EDR RF Test (I)

Bluetooth transmission equipment operates in the 2.4GHz ISM (Industrial, Scientific, Medical) frequency band. This specification establishes the dedicated operating frequency band range of Bluetooth transmission equipment.
Based on this, the Bluetooth system must meet the following two necessary conditions:
●
[Test Measurement]

The Importance of High-Quality Signal Sources for Microwave and RF Equipment

Overview In the field of wireless communications, the development direction of communication signals is digitalization. This trend is mainly because digital signals have good spectrum efficiency compared to analog signals. In order to meet the increasingly demanding user requirements for signal center frequency, spect
[Test Measurement]

Introducing the RF Power Meter - An Ultra-Compact, Multi-Function RF Instrument

Summary A power meter is an instrument for measuring electrical power, consisting of a power sensor and a power indicator. A RF power meter is a high-performance portable ultra-high frequency power meter for measuring various complex waveforms. It can effectively solve the problem of measuring the frequency and amplit
[Test Measurement]

Advantages of the NI RF Platform for Test Applications

Overview
NI provides high-speed, flexible, and precise RF hardware, coupled with powerful NI LabVIEW software, to meet the ever-changing needs of wireless communications and cover all engineering stages from design, verification to production.
In order to meet the ever-evolving communication standards, Lab
[Test Measurement]

- Popular Resources
- Popular amplifiers
-
 Radio Frequency Identification (RFID) System Technology and Application (Written by Ci Xinxin, Wang Subin, and Wang Shuo)
 -
 Research on the relationship between load variables in microwave heating system based on radio frequency circuit
 -
 IoT Identification Technology
 -
 Basics of Machine Learning: From Getting Started to Job Hunting (Hu Huanwu)
Recommended Content
Latest Test Measurement Articles
- Modern manufacturing strategies drive continuous improvement in ICT online testing
- Methods for Correlation of Contact and Non-Contact Measurements
- Keysight Technologies Helps Samsung Electronics Successfully Validate FiRa® 2.0 Safe Distance Measurement Test Case
- From probes to power supplies, Tektronix is leading the way in comprehensive innovation in power electronics testing
- Seizing the Opportunities in the Chinese Application Market: NI's Challenges and Answers
- Tektronix Launches Breakthrough Power Measurement Tools to Accelerate Innovation as Global Electrification Accelerates
- Not all oscilloscopes are created equal: Why ADCs and low noise floor matter
- Enable TekHSI high-speed interface function to accelerate the remote transmission of waveform data
- How to measure the quality of soft start thyristor
MoreSelected Circuit Diagrams
MorePopular Articles
- Intel promotes AI with multi-dimensional efforts in technology, application, and ecology
- ChinaJoy Qualcomm Snapdragon Theme Pavilion takes you to experience the new changes in digital entertainment in the 5G era
- Infineon's latest generation IGBT technology platform enables precise control of speed and position
- Two test methods for LED lighting life
- Don't Let Lightning Induced Surges Scare You
- Application of brushless motor controller ML4425/4426
- Easy identification of LED power supply quality
- World's first integrated photovoltaic solar system completed in Israel
- Sliding window mean filter for avr microcontroller AD conversion
- What does call mean in the detailed explanation of ABB robot programming instructions?
MoreDaily News
- Vicor high-performance power modules enable the development of low-altitude avionics and EVTOL
- Chuangshi Technology's first appearance at electronica 2024: accelerating the overseas expansion of domestic distributors
- Chuangshi Technology's first appearance at electronica 2024: accelerating the overseas expansion of domestic distributors
- "Cross-chip" quantum entanglement helps build more powerful quantum computing capabilities
- Ultrasound patch can continuously and noninvasively monitor blood pressure
- Ultrasound patch can continuously and noninvasively monitor blood pressure
- Europe's three largest chip giants re-examine their supply chains
- Europe's three largest chip giants re-examine their supply chains
- Breaking through the intelligent competition, Changan Automobile opens the "God's perspective"
- The world's first fully digital chassis, looking forward to the debut of the U7 PHEV and EV versions
Guess you like
- I have an urgent question about eye diagram simulation in ADS. I hope you can give me some advice!
- Memory Compression Technology in Embedded Systems
- Zhongtong Bus ERP Project Experience 2
- Porting shttpd Web
- Introduction to Flyback Converter
- Why are all the packets captured by USB Dongle empty?
- Share and discuss: About the VDDIO and VLDO pins of the LP8863ADCPRQ1 chip
- TI releases mmWave fundamentals (white paper)
- Ultra-low power Bluetooth controlled, cost-effective, dimmable smart lighting solution
- Electromagnetic field simulation optimization software package-----IE3D

 Radio Frequency Identification (RFID) System Technology and Application (Written by Ci Xinxin, Wang Subin, and Wang Shuo)


 京公网安备 11010802033920号