The signal source of traditional frequency sweepers mostly uses an oscillator composed of LC circuits, and a large number of discrete components are used to realize various functions. The display part uses a traditional scanning display. Therefore, the traditional frequency sweeper is not only complex in structure, large in size, expensive, and complicated to operate, but also because of the large dispersion of each component, the parameter change is easily affected by the change of the external environment, and the accuracy is not high. At present, instrument manufacturers represented by Agilent and others provide a variety of high-performance frequency characteristic testers. However, their products are mainly concentrated in high-frequency fields such as radio frequency and microwave, and products in the medium and low frequency bands are relatively scarce. Based on the technical idea of direct digital frequency synthesis (DDS), this paper uses modern digital signal processing technology with DSP and FPGA architecture to design a low-cost, highly digital and intelligent frequency characteristic tester, which realizes the measurement and display of the amplitude-frequency characteristics and phase-frequency characteristics of the network under test in any frequency band within the range of 20 Hz to 150 MHz, and completes data storage, playback and transmission, -3 dB bandwidth calculation, peak search and other functions. The amplitude detection accuracy reaches 1dBm, and the phase detection accuracy reaches 1°.
1 System composition
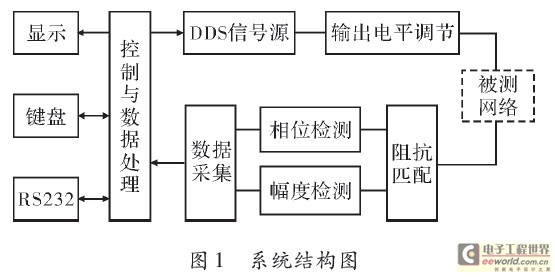
The frequency characteristics analyzer mainly includes a control and data storage processing unit, a DDS signal source unit, an amplitude and phase detection unit, a data acquisition unit, and a display and interactive interface unit. The overall system block diagram is shown in Figure 1.

2 System Design
2.1 Control and data processing unit
ADSP-BF532 and FPGA (EP1C3) are the core of the control and data storage processing unit. DSP communicates with FPGA via PPI, SPI and PF interfaces to realize keyboard reading, DDS scanning, A/D acquisition, LCD scanning and other functions, and realizes data transmission and remote control with the computer through the UART unit. FPGA completes the functions of TFT_LCD and VGA synchronous display timing conversion, keyboard scanning, SPI communication and signal distribution. In addition, DSP connects AM29LV800 and MT48L32M16 through the EBIU unit as program and working state memory and data storage and display cache respectively. The working principle is shown in Figure 2.

2.2 Data Acquisition Unit
The data acquisition unit uses a multi-channel A/D converter to convert the analog voltage signal of amplitude and phase into a digital signal for DSP and FPGA to process and transmit. It is a "bridge" between analog circuits and digital circuits. AD7655 is selected in this instrument to collect signals. The A/D converter has 4 analog input channels, 16-bit sampling accuracy, and a maximum sampling rate of 1MHz. It uses 16-bit parallel and SPI transmission modes. REF3125 provides the 2.5 V reference voltage required by the A/D converter.
2.3 DDS signal source unit
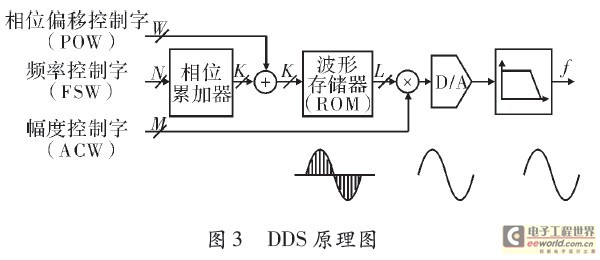
DDS technology is a synthesis technology that converts a series of digital signals into analog signals through DAC. DDS technology is based on the sampling theorem. It first samples the waveform to be generated, digitizes the sampled value and stores it in the memory as a lookup table, then reads the data through the lookup table, converts it into analog through the D/A converter, and resynthesizes the stored waveform. Although there are many types of DDS system structures, its basic circuit principle is shown in Figure 3.

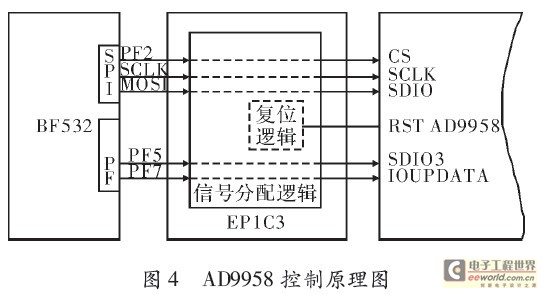
The DDS chip AD9958 selected in this instrument is a high-performance dual-channel direct digital frequency synthesizer with two independent DDS cores, two independent 32-bit frequency control words and 14-bit phase control words, and a 10-bit amplitude control word. The internal integrated PLL has a maximum operating frequency of 500 MHz and a maximum output signal frequency of 180 MHz. The DSP configures the frequency, phase and amplitude control words of AD9958 through the SPI and PF interfaces via the FPGA signal distribution logic, as shown in Figure 4.

AD9958 uses a 25 MHz external clock input, which generates a 500 MHz core operating clock after internal PLL multiplication. The output signal is two sine and cosine signals of the same frequency. To avoid digital noise from interfering with the signal, the 3.3 V digital power supply and analog power supply of the chip need to be isolated by a network, and a small resistor is connected to the ground plane for analog ground to isolate interference. Since the chip output is a current signal, it needs to be pulled up to 1.8 V with 51Ω to convert it into a voltage signal, and the high-frequency noise is filtered out by the LFCN-160 integrated filter, and the differential op amp AD8312 is used to offset the common-mode noise. The output signal level range is -10 to -3 dBm. The AD9958 signal output principle is shown in Figure 5.

2.4 Output level adjustment unit
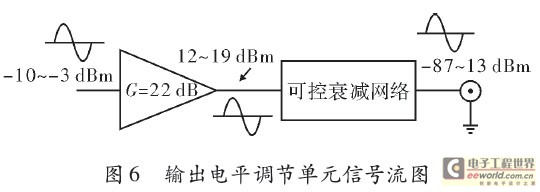
The output level range of the signal source designed for this instrument is -87 to 13 dBm. The output signal level range of the front-stage DDS signal source unit is -10 to -3 dBm, so the level of the front-stage signal needs to be adjusted. The signal flow diagram of this unit is shown in Figure 6.

This unit first amplifies the pre-stage signal level to 12-19 dBm through the broadband operational amplifier THS3201. Then the output signal in the range of -87-13 dBm is realized through the controllable attenuation network. This is achieved by controlling the connection of different types of resistor attenuation networks, as shown in Figure 5. The controllable attenuation network consists of four types of resistor attenuation networks: -8 dB, -16 dB, -32 dB and -64 dB. The attenuation networks with different attenuation multiples are combined through the 68595 driving relay TQ2. [page]
2.5 Phase Detection Unit
This instrument uses AD8302 to construct a phase difference detection circuit. AD8302 can accurately measure the amplitude ratio and phase difference between two input signals in the range of 0 to 2.7 GHz and -60 to 0 dBm, and the phase detection accuracy can reach 1°. The phase detection curve of AD8302 is shown in Figure 7.

As shown in Figure 7, it is impossible to monitor the phase within the range of -180° to 180° using a single AD8032. To achieve phase monitoring from -180° to 180°, the instrument uses an I, Q quadrature detection method. That is, the DDS signal source outputs two orthogonal signals of the same frequency, which enter the two AD8302s for phase monitoring respectively through two 8302s and the signal to be measured, and then two phase curves with a phase difference of 90° can be obtained, as shown in Figure 8. This achieves detection in the range of -180° to 180°.

2.6 Amplitude Detection Unit
The amplitude detection circuit of this instrument is composed of logarithmic amplifier AD8310 and filter capacitor unit. AD8310 can detect the amplitude value of the signal in the range of 0~440 MHz, -91~+4 dBV. Its output formula is:
Among them, VOUT is the detection output; VY is the slope voltage; VIN is the input signal voltage; VX is the cut-off voltage.
The capacitance of the OFLT and BFIN pins of AD8310 needs to be adjusted in real time according to the sweep frequency. After repeated tests, the combination of 0.01μF, 0.1μF, 1μF, 10μF and 100μF can achieve accurate detection in the range of 20 Hz to 150 MHz.
3 Test results
This test measures the LPF-BOR8 low-pass filter. The cutoff frequency of the filter is 1.2 MHz. After the instrument is powered on, the output level is first set to 0 dBm, the start frequency is set to 20 Hz, and the stop frequency is set to 1.5 MHz. Then the output and input of the instrument are short-circuited to perform amplitude and phase correction. After correction, the output of the instrument is connected to the input of the filter, and the output of the filter is connected to the input of the instrument for measurement. The measurement results are shown in Figure 9. As can be seen from the figure, the passband of the filter is relatively stable, the phase tends to be linear, and the -1 dB turning point is about 1.2 MHz, which is consistent with the data given in the device data sheet.

4 Conclusion
The instrument can measure the amplitude-frequency characteristics and phase-frequency characteristics of the network under test in any frequency band within the range of 20 Hz to 150 MHz, store data, play back, find peak values, and calculate -3 dB and Q value. The extensive use of large-scale integrated circuits not only improves the system integration and reduces the volume, but also improves the performance and stability of the instrument. It has achieved digitalization, intelligence, and low cost. The instrument has entered the production stage.
Previous article:Intelligent frequency characteristics tester system composition and application
Next article:A brief discussion of the six common problems encountered by spectrum analyzer users
- Keysight Technologies Helps Samsung Electronics Successfully Validate FiRa® 2.0 Safe Distance Measurement Test Case
- From probes to power supplies, Tektronix is leading the way in comprehensive innovation in power electronics testing
- Seizing the Opportunities in the Chinese Application Market: NI's Challenges and Answers
- Tektronix Launches Breakthrough Power Measurement Tools to Accelerate Innovation as Global Electrification Accelerates
- Not all oscilloscopes are created equal: Why ADCs and low noise floor matter
- Enable TekHSI high-speed interface function to accelerate the remote transmission of waveform data
- How to measure the quality of soft start thyristor
- How to use a multimeter to judge whether a soft starter is good or bad
- What are the advantages and disadvantages of non-contact temperature sensors?
- Innolux's intelligent steer-by-wire solution makes cars smarter and safer
- 8051 MCU - Parity Check
- How to efficiently balance the sensitivity of tactile sensing interfaces
- What should I do if the servo motor shakes? What causes the servo motor to shake quickly?
- 【Brushless Motor】Analysis of three-phase BLDC motor and sharing of two popular development boards
- Midea Industrial Technology's subsidiaries Clou Electronics and Hekang New Energy jointly appeared at the Munich Battery Energy Storage Exhibition and Solar Energy Exhibition
- Guoxin Sichen | Application of ferroelectric memory PB85RS2MC in power battery management, with a capacity of 2M
- Analysis of common faults of frequency converter
- In a head-on competition with Qualcomm, what kind of cockpit products has Intel come up with?
- Dalian Rongke's all-vanadium liquid flow battery energy storage equipment industrialization project has entered the sprint stage before production
- Allegro MicroSystems Introduces Advanced Magnetic and Inductive Position Sensing Solutions at Electronica 2024
- Car key in the left hand, liveness detection radar in the right hand, UWB is imperative for cars!
- After a decade of rapid development, domestic CIS has entered the market
- Aegis Dagger Battery + Thor EM-i Super Hybrid, Geely New Energy has thrown out two "king bombs"
- A brief discussion on functional safety - fault, error, and failure
- In the smart car 2.0 cycle, these core industry chains are facing major opportunities!
- The United States and Japan are developing new batteries. CATL faces challenges? How should China's new energy battery industry respond?
- Murata launches high-precision 6-axis inertial sensor for automobiles
- Ford patents pre-charge alarm to help save costs and respond to emergencies
- New real-time microcontroller system from Texas Instruments enables smarter processing in automotive and industrial applications
- "Recommend Chinese chips" + domestic FPGA
- [Rawpixel RVB2601 Creative Application Development] Running Routine HELLOWORLD
- EEWORLD University ---- Microwave Technology Basics
- How to deploy and install docker service on arm platform
- [SAMR21 New Gameplay] 6. Graphical Programming - Breathing Light 2
- MS3142 can replace A3906
- FPGA implementation of parallel fast FIR filter.pdf
- Sensor selection
- [Atria AT32WB415 series Bluetooth BLE 5.0 MCU] + IAP (Bootloader)
- 【Radio Waves】What is the source of Bluetooth? Does it have any radiation that may affect your health? Is it safe?

 Signal Integrity and Power Integrity Analysis (Eric Bogatin)


 京公网安备 11010802033920号