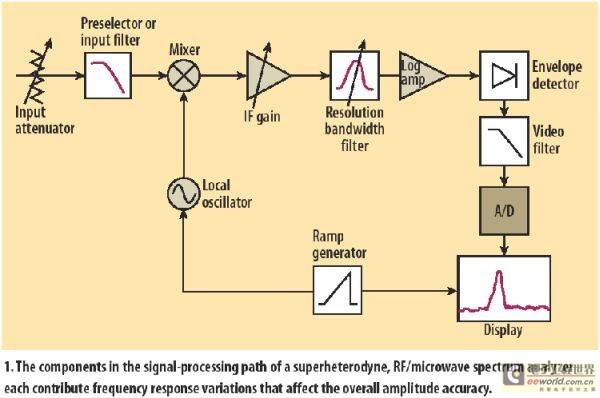
The swept frequency superheterodyne spectrum analyzer converts the input signal to the intermediate frequency (IF) through a mixer, and performs amplification, filtering and detection processing at the intermediate frequency. The preselection filter (sometimes a low-pass filter) is mainly used to filter out the signal of the image frequency. The reference level displayed on the spectrum analyzer screen is related to the gain of the intermediate frequency amplifier. The amplifier only adjusts the vertical position of the signal displayed on the screen and does not affect the level of the input attenuator. The horizontal axis of the screen is the frequency, and the vertical axis is the measured signal level, which is generally expressed in linear voltage Volt or logarithmic dB.
The amplitude accuracy of a spectrum analyzer is usually measured in two ways: absolute accuracy and relative accuracy. Absolute accuracy refers to the accuracy of the signal's power level in dBm, while relative accuracy refers to the accuracy of measuring the difference between two signals, one of which is used as a reference for the other, such as when measuring harmonic signals, the power ratio of the harmonic to the fundamental is generally measured. Both of these accuracies can be improved by measuring a calibration source with very accurate amplitude and frequency.
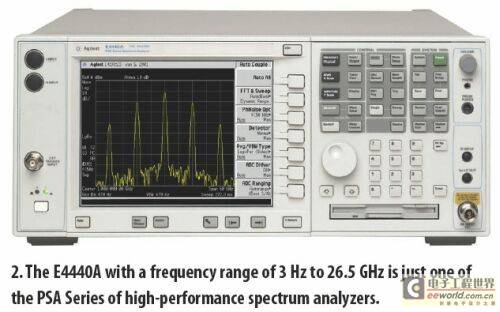
The front-end signal processing components in the spectrum analyzer, such as amplifiers, filters, and mixers, are all sources of amplitude measurement errors. In many spectrum analyzer designs, using better components can improve accuracy. Agilent Technologies' high-performance spectrum analyzer PSA series (as shown in Figure 2) uses a complete set of digital IF filters to avoid the amplitude variation of analog IF filters. However, simply improving some components in the entire signal processing chain is not enough to eliminate all sources of error. A better understanding of the interaction between the various modules of the spectrum analyzer can help reduce errors and improve amplitude measurement accuracy.
Why is the accuracy of amplitude measurement so important? For example, some communication standards require that the modulated carrier power cannot exceed a certain value, which places requirements on absolute accuracy; too many harmonics or spurious signals will interfere with other communication systems, which also places requirements on relative accuracy. The amplifiers in these systems must meet specific linearity requirements to ensure that no higher harmonics and spurious signals are generated. For the filters in these systems, the passband and stopband characteristics must be measured simultaneously.
|
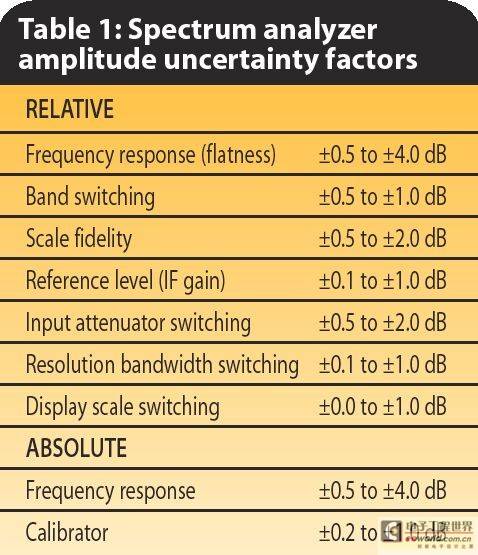
The interaction between the various components of the spectrum is one source of error. Table 1 lists some of the sources of amplitude measurement error. Most instrument manufacturers specify both absolute and relative uncertainty in their product specifications. Because relative uncertainty affects both measurements, this article will focus on relative uncertainty.
|
The frequency response flatness of a spectrum analyzer is one of the main sources of amplitude error. This specification describes the relative amplitude uncertainty as a function of frequency and is affected by the input attenuator, mixer, local oscillator amplitude, and the frequency response flatness of the input filter. Frequency response uncertainty is generally expressed in two ways: absolute and relative. Relative uncertainty describes the maximum possible amplitude uncertainty relative to the center frequency point over the entire frequency range and is generally smaller than the absolute uncertainty in the same frequency band. However, in order to obtain the frequency response uncertainty of a relative amplitude measurement within a certain band, the relative frequency response index value must be multiplied by two to reflect the peak-to-peak value of the frequency response within the entire band, which results in it usually being higher than the absolute frequency response index.
Spectrum analyzers usually use YIG tuned filters as pre-selection filters, and YIG filters will also affect the frequency response characteristics of the spectrum analyzer. The filter must be precisely tuned and aligned to avoid introducing additional frequency response changes. Since the scanning speed of the local oscillator is limited, the YIG filter must also add some delays and compensation to ensure that its center frequency is synchronized with the local oscillator. A low-pass filter is usually added to the front end of the spectrum analyzer. When measuring low-end frequency signals that the YIG pre-selector cannot reach (usually below 2GHz), this low-pass filter is used to filter out high-frequency signals. Although this filter will also affect the overall frequency response characteristics, its impact is much smaller than that of the YIG filter.
Since some spectrum analyzers use harmonic mixing technology, there are actually many mixing frequency bands inside the instrument, and each frequency band has a specific frequency response. Therefore, uncertainty will be introduced when switching between frequency bands. For example, the E4440A spectrum analyzer of the PSA series to 26.5GHz has five internal mixing frequency bands, namely: 3 Hz to 3 GHz, 2.85 to 6.6 GHz, 6.2 to 13.2 GHz, 12.8 to 19.2 GHz, and 18.7 to 26.5 GHz. When the set frequency span exceeds two mixing frequency bands, the instrument will automatically switch the internal mixing frequency band, thereby introducing amplitude uncertainty. When measuring the relative value of two signals in different mixing frequency bands, the total uncertainty is equal to the sum of the frequency responses of the two frequency bands plus the frequency band switching uncertainty. If the uncertainty of frequency band switching is not specified in the specification, the absolute frequency response parameters with the calibration source as the reference can be used to determine the total measurement uncertainty of each frequency band (see Table 1).
|
Another source of uncertainty in spectrum analyzers is the reliability of the range. When measuring two signals at different vertical positions (ranges), the reliability of different ranges will affect the results. The linearity of the detector and ADC, and the linearity of the logarithmic/linear amplifier will affect the reliability of the range. For most logarithmic amplifiers, their linearity deteriorates as the input level decreases.
For two signals with similar amplitudes, the uncertainty of the range is about a few tenths of a dB, and for signals with greatly different amplitudes, this uncertainty can reach 2 dB. The typical range reliability index is: ±0.4 dB/4 dB, with a cumulative maximum value of ±1.0 dB. The ±0.4 dB/4 dB index is applicable to signals with similar amplitudes, while the cumulative index is applicable to signals with greatly different amplitudes.
When a spectrum analyzer is measuring signals of different levels, flexibility can be achieved by adjusting the reference level, but adjusting the reference level will also introduce uncertainty. The reference level is related to the input attenuator and the IF gain, and can range from the displayed average noise floor (DANL) to the maximum input level it can withstand. Adjusting the reference level is actually adjusting the gain of the IF amplifier, and the IF amplifier itself (like all amplifiers) has a gain that varies with amplitude and frequency. Therefore, any adjustment of the reference level during the test will introduce uncertainty.
The reference level is usually calibrated by the standard reference source inside the instrument (of course, an external source can also be used). Similar to the built-in standard source of many power meters, the PSA series spectrum analyzer has a built-in standard source with a frequency of 50MHz and a power of -25dBm, and its amplitude accuracy is ±0.24 dB (while the amplitude and frequency of the built-in standard source of the ESA-E series universal spectrum analyzer are the same as those of the PSA, but the accuracy is ±0.34 dB). Therefore, when the reference level is set to -25dBm and the attenuator is set to 10dB, the measurement accuracy of the spectrum analyzer is the highest, because the parameters related to the reference level of the spectrum analyzer are calibrated in this state.
The reference level uncertainty is usually given as: ±0.3 dB at -20 dBm. As the reference level deviates from -20 dBm, this indicator will increase. It should be noted that different instruments may use different terms for "reference level uncertainty" in their specifications. For example, Agilent Technologies' 8560 series portable spectrum analyzers use the term "IF gain uncertainty" in their specifications, while the PSA series uses the term "reference level accuracy."
|
Since the attenuation value of RF microwave attenuators varies with frequency (and sometimes even with temperature), the accuracy of step attenuators is also a function of frequency. In addition, if the attenuator settings during reference level calibration are different from the actual measurement settings, uncertainty will also be introduced. The accuracy of most attenuators deteriorates with increasing frequency, and the typical uncertainty of attenuator switching is ±1 dB.
Since the frequency response of analog filters is not ideal, the output amplitude characteristics of filters with different bandwidths will be quite different. Therefore, when measuring, switching the resolution bandwidth filter will also introduce uncertainty, especially when using analog filters. Digital filters perform very well in this regard, but the implementation cost of digital filters is higher. Therefore, in the ESA series mid-range spectrum analyzers, the digital intermediate frequency filter is only 300Hz, and the higher bandwidth filters are analog.
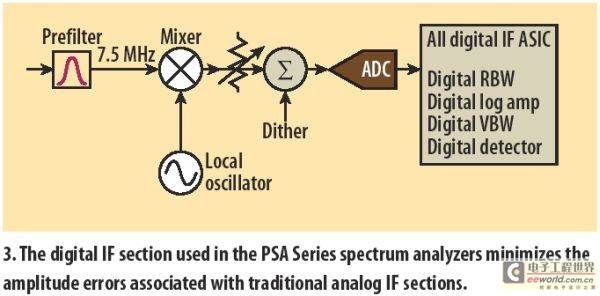
The high-end PSA series adopts a fully digital design for the intermediate frequency processing part, which also includes FFT analysis and digital frequency sweep receiver. This design not only improves the amplitude measurement accuracy, but also increases the sweep speed.
Changing the scale of each grid displayed on the screen will also affect the measurement accuracy. For example, if the scale is changed from 10dB per grid to 1dB per grid, the characteristics of the logarithmic/linear amplifier of the spectrum analyzer will change, which will also introduce uncertainty. Of course, keeping the scale unchanged during the measurement can avoid this error. The typical linear-to-logarithmic conversion uncertainty is ±0.25 dB at the reference level, but if the spectrum analyzer is displaying a saved trace at this time, this uncertainty has no effect on the measurement.
The total relative amplitude measurement uncertainty is affected by the superposition of all the above factors. Some errors come from changing settings. If the attenuator, resolution bandwidth, reference level and other settings remain unchanged, all related uncertainties can be eliminated and the total uncertainty can be minimized. For example, since the PSA series spectrum analyzer uses a fully digital resolution bandwidth filter, it will not introduce additional errors when switching the resolution bandwidth, and its accuracy is much higher than that of a spectrum analyzer using an analog filter.
To improve the accuracy of relative amplitude measurements, the simplest method is not to change the settings during the measurement process: do not change the resolution filter settings, but for instruments that use all-digital filters like PSA, you can change the resolution bandwidth filter; ensure that the same attenuator settings are used during reference level calibration and actual measurement; do not change the scale of each grid during the test.
The signal transmission network connecting the spectrum analyzer and the device under test will affect the characteristics of the measured signal, so the characteristics of these networks must also be compensated. Usually, the built-in amplitude correction function of the spectrum analyzer is used, and the test signal source and power meter are added to measure the frequency response characteristics of the network. The measurement results are stored in a table inside the spectrum analyzer, and the data in the table can be used for correction during measurement. For accessories such as antennas and cables that must be used in certain tests, the above method can also be used for compensation. In addition, the instrument can store many groups of data to cope with different settings.
|
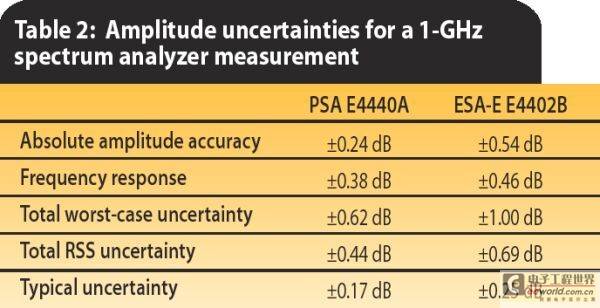
Below is a typical example of calculated uncertainty. In this example, the frequency of the measured signal is 1 GHz and the amplitude is -20 dBm. In order to compare the test accuracy of different instruments, the high-end PSA series 4440A and the mid-range ESA-E series E4402A spectrum analyzers were selected. All settings are the same: attenuation is 10 dB, frequency span is 20 KHz, reference level is -10 dBm, sweep time is set to automatic, resolution bandwidth is 10 KHz, and video bandwidth is 1 KHz. The ambient temperature is room temperature (+20 to +30°C). The nominal absolute amplitude uncertainty of the E4440A PSA (digital IF filter) is ±0.24 dB, while the specification of the ESA (analog IF filter) is ±0.54 dB. The above two numbers plus the absolute frequency response of the two spectrum analyzers are the worst-case uncertainty. For higher frequency signals, especially harmonic testing, the uncertainty will be greater because the instrument needs to switch internal mixing frequency bands.
The use of digital intermediate frequency filters can effectively improve the measurement accuracy of spectrum analyzers. During the measurement process, reasonable instrument settings can also ensure that the test results can meet the best accuracy given by the instrument.
Previous article:Measuring DC Offset of AC Signal Using a Timing Meter
Next article:Accelerate development and debugging of video devices by capturing and analyzing video frames
- Keysight Technologies Helps Samsung Electronics Successfully Validate FiRa® 2.0 Safe Distance Measurement Test Case
- From probes to power supplies, Tektronix is leading the way in comprehensive innovation in power electronics testing
- Seizing the Opportunities in the Chinese Application Market: NI's Challenges and Answers
- Tektronix Launches Breakthrough Power Measurement Tools to Accelerate Innovation as Global Electrification Accelerates
- Not all oscilloscopes are created equal: Why ADCs and low noise floor matter
- Enable TekHSI high-speed interface function to accelerate the remote transmission of waveform data
- How to measure the quality of soft start thyristor
- How to use a multimeter to judge whether a soft starter is good or bad
- What are the advantages and disadvantages of non-contact temperature sensors?
- Innolux's intelligent steer-by-wire solution makes cars smarter and safer
- 8051 MCU - Parity Check
- How to efficiently balance the sensitivity of tactile sensing interfaces
- What should I do if the servo motor shakes? What causes the servo motor to shake quickly?
- 【Brushless Motor】Analysis of three-phase BLDC motor and sharing of two popular development boards
- Midea Industrial Technology's subsidiaries Clou Electronics and Hekang New Energy jointly appeared at the Munich Battery Energy Storage Exhibition and Solar Energy Exhibition
- Guoxin Sichen | Application of ferroelectric memory PB85RS2MC in power battery management, with a capacity of 2M
- Analysis of common faults of frequency converter
- In a head-on competition with Qualcomm, what kind of cockpit products has Intel come up with?
- Dalian Rongke's all-vanadium liquid flow battery energy storage equipment industrialization project has entered the sprint stage before production
- Allegro MicroSystems Introduces Advanced Magnetic and Inductive Position Sensing Solutions at Electronica 2024
- Car key in the left hand, liveness detection radar in the right hand, UWB is imperative for cars!
- After a decade of rapid development, domestic CIS has entered the market
- Aegis Dagger Battery + Thor EM-i Super Hybrid, Geely New Energy has thrown out two "king bombs"
- A brief discussion on functional safety - fault, error, and failure
- In the smart car 2.0 cycle, these core industry chains are facing major opportunities!
- The United States and Japan are developing new batteries. CATL faces challenges? How should China's new energy battery industry respond?
- Murata launches high-precision 6-axis inertial sensor for automobiles
- Ford patents pre-charge alarm to help save costs and respond to emergencies
- New real-time microcontroller system from Texas Instruments enables smarter processing in automotive and industrial applications
- [National Technology N32 Bluetooth chip development package] --N32WB452 series
- Regarding the use of UCC27531, I just want to ask a small question
- XC3S200A chip loading problem
- AD strange line. Can't delete it no matter what, please help
- Discounted boards are reduced by 100 yuan! Components are available as low as 0 yuan!
- MSP430G2553 clock external crystal configuration instructions
- Difficulty in UHF reader design - anti-collision
- How to use MSP430 hardware I2C - Taking BH1710 and AT24C02 as examples
- Master the direct drive configuration of GaN devices in one article!
- Is it just a problem with the PCB backplane?

 Multisim Circuit System Design and Simulation Tutorial
 Editing Spectrum Analyzer


 京公网安备 11010802033920号