In real life, due to the influence of various factors such as sunlight angle, clouds, shadows, etc., the sunlight irradiance and corresponding temperature received by the photovoltaic array will vary greatly under different conditions. For example, in the morning and noon, in clear and cloudy weather, especially the influence of cloud cover, the irradiance may change dramatically in a short period of time. Therefore, for photovoltaic inverters, they must have a strategy to deal with the continuous change of sunlight irradiance, always maintain or restore to a high MPPT accuracy level and high conversion efficiency in the shortest possible time, in order to achieve good power generation effects in real life.
At present, major manufacturers in the photovoltaic inverter industry have basically demonstrated a high level of processing for static MPPT tracking algorithms, which can be accurately maintained at a level very close to 100%, providing a good foundation for the back-end DC to AC process. This is also reflected in the overall efficiency parameters of inverters of various models, and the nominal values are generally very high. In the actual working environment of the inverter, external conditions such as sunshine and temperature are in a real-time dynamic change process. When the inverter works under such conditions, its dynamic performance has become an important indicator that cannot be ignored to measure its actual performance.
In the laboratory test environment, photovoltaic simulators, as efficient simulators that can directly simulate photovoltaic arrays of various types and configurations, have been widely used in inverter testing. However, previous tests have focused more on simulating various static conditions (i.e. maintaining a given IV curve unchanged during the test), or limited low-intensity changes (such as switching between two or more given IV curves during the test), and less on simulating long-term, high-intensity real working conditions. The author focuses on using photovoltaic simulators to simulate the dynamic output of photovoltaic arrays over time, and explores the practicality of this dynamic MPPT test function and the key points that need to be noted.
Since the combinations of dynamic weather are almost endless, the first question is what typical types of weather documents are provided by the PV simulator, whether there is enough flexibility for customers to generate new weather documents by themselves, and whether it provides a high enough time resolution to support rapid irradiance changes. Let's take the photovoltaic simulator product of AMETEK ELGAR, a well-known brand in the photovoltaic simulation and testing industry, as an example. It provides typical weather conditions such as sunny, cloudy, and overcast days (as shown in Figure 1 below). In addition, it supports the generation of custom weather documents directly in the software or through external data processing software (such as EXCEL), with a time resolution of 1 second. There is no limit on the time length of the weather document, which can support long-term testing, such as a week or even longer.
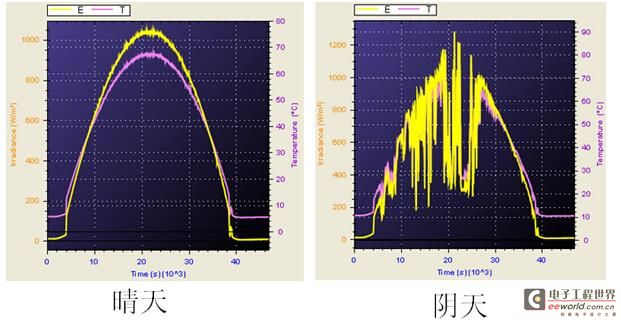
Figure 1. Changes in irradiance and temperature on sunny and cloudy days. The horizontal axis is time, the yellow line is irradiance, and the purple line is temperature.
Some organizations in the industry have also defined some "standard" test forms to compare different inverters according to the same standards. For example:
1. Sandia National Laboratory defines several different modes of irradiance and temperature variation.
-- Rapid change (irradiance increases linearly from 100W/m2 to 800W/m2 in 3 seconds and decreases in the opposite direction)
-- Slow change (irradiance increases linearly from 0W/m2 to 1000W/m2 in half an hour and then decreases back to 0 at the same rate, and the temperature increases from 5 degrees to 60 degrees and then returns to 5 degrees during the same period)
-- Triangular variation (irradiance increases linearly from 100W/m2 to 800W/m2 in 30 seconds and then decreases back to 100W/m2 at the same rate, repeated 60 times)
-- Temperature change (10 seconds from 35 degrees to 75 degrees linearly and then drop back to 35 degrees at the same rate, repeat 15 times)
2. IEC/EN50530 defines different test modes in Appendix B.
-- Low to medium irradiance with different rates (from 100W/m2 to 500W/m2, 11 different rates, slowest 800 seconds, fastest 8 seconds)
-- Different rate changes from medium to high irradiance (from 300W/m2 to 1000W/m2, 6 different rates, slowest 70 seconds, fastest 7 seconds)
3. The definition of dynamic efficiency test mode in CGC/GF004 is the same as that in EN50530.
It should be said that these standards provide good reference conditions, which facilitate inverter manufacturers to conduct targeted research on improving dynamic MPPT performance. These standards focus more on changes in irradiance rather than changes in temperature, because the output power of photovoltaic modules is particularly affected by irradiance, while the impact of temperature is relatively small. It should be noted that these standards do not give mandatory requirements for the time resolution of irradiance changes, but they essentially require further linear interpolation while taking seconds as the basic unit to meet this test form.
Taking EN50530 as an example, the fastest requirement for the rate of change of irradiance is 100W/m2/s, which means that the change from 300W/m2 to 1000W/m2 can be achieved in 7 seconds. If we only adopt the method of changing the irradiance once every 1 second, we will get the following step-like irradiance change graph (Figure 2) with a step of 1 second, instead of the linear change irradiance graph (Figure 3) required by the standard.
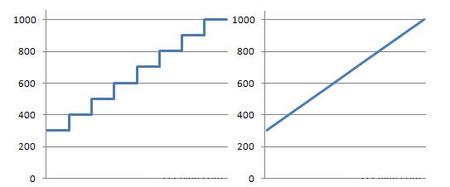
Figure 2 Step-like irradiance change with 1 second as the step Figure 3 Ideal linear irradiance change
Through simple mathematical calculations, we take a nominal 1KW inverter under standard test conditions (STC, 1000W/m2, 25 degrees Celsius) as an example to evaluate the impact of this step-by-step change. According to the photovoltaic array I/V curve fitting formula defined in Appendix C of EN50530, the corresponding theoretical maximum power points of the crystalline silicon model and the thin film model under the corresponding irradiance are listed as follows.
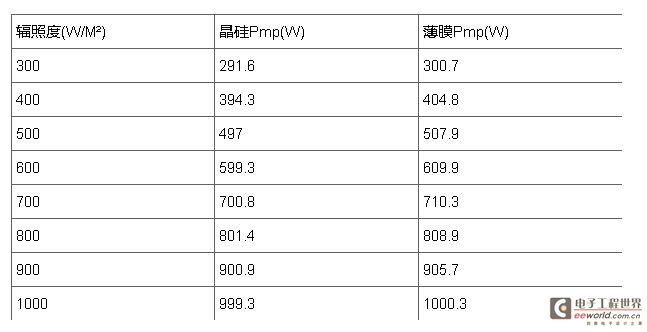
That is to say, every 100W/m2 irradiance change will cause the maximum power point (hereinafter referred to as Pmp) of the output IV curve of the photovoltaic simulator to jump by about 10% of the nominal power. In addition, through simple mathematical calculations, it can be obtained that the difference in actual power supplied to the inverter caused by this step-like change method and the ideal situation is 707W less for the crystalline silicon model and 700W less for the thin film model in the 7 seconds when the irradiance increases linearly, that is, about 100W less per second, about 10% of the nominal power is insufficient. Similarly, when the irradiance decreases linearly, about 100W more will be supplied per second, about 10% of the nominal power is oversupplied. This 10% supply power difference is entirely due to the algorithm of the photovoltaic simulator itself. For high-speed inverters, this difference may seriously affect their performance, making it unable to exert its true capabilities and unable to distinguish it from other relatively low-speed inverters.
The solution to this problem is to perform linear interpolation every second, so that the IV curve given by the photovoltaic simulator fits the ideal linear change as closely as possible. For example, the photovoltaic simulator of AMETEK ELGAR can perform linear interpolation 128 times per second, which means that a new IV curve will be automatically changed every 7.8 milliseconds, which is equivalent to almost seamless switching between curves. However, such high-speed changes will introduce another problem, that is, the calculation problem of MPPT tracking accuracy.
At present, all manufacturers basically rely on the MPPT precision measurement function provided by the photovoltaic simulator itself to directly calculate the MPPT efficiency of the inverter. The calculation method is to multiply the current output voltage by the output current to obtain the current actual output power, and then divide it by the Pmp of the current IV curve. The acquisition of the current actual output voltage and current values requires real-time measurement. There is a problem with the length of the measurement time window. In theory, a longer time length is better, such as 20ms or more, in order to filter out ripple interference to obtain high-precision readings; and another more important and more influential problem is the synchronization problem.
When the IV curve is in a high-speed automatic linear interpolation state (for example, it is updated every 7.8 milliseconds), it is obvious that the conventional 20ms measurement window cannot match it. When the 20ms measurement sampling time is completed and an output power value is obtained, the IV curve has been updated two or three times. We divide this measurement value by the Pmp value of the IV curve currently used, and the MPPT efficiency obtained will obviously be distorted. Therefore, when the irradiance is in an upward state, the MPPT efficiency reported by the photovoltaic simulator will be low; when the irradiance is in a downward state, the MPPT efficiency reported by the photovoltaic simulator will be high. The following figure (Figure 4) is a test result of an irradiance decrease from 1000W/m2 to 300W/m2 at a rate of 100W/m2, and the photovoltaic simulator performs 128 interpolations per second. We can clearly see that the actual output power reported by the photovoltaic simulator represented by the red line is higher than the Pmp of the ideal IV curve represented by the linear decline represented by the blue line, so that the calculated MPPT efficiency will exceed 100%.
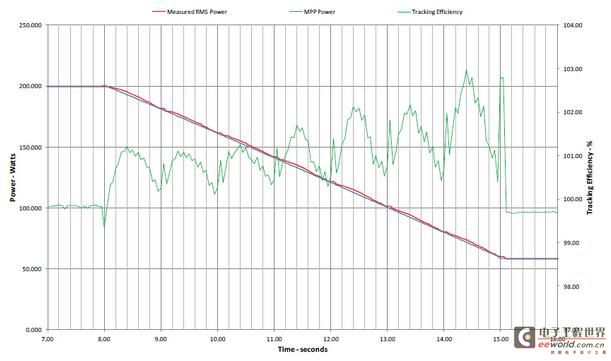
Figure 4: When the irradiance decreases linearly at 100 W/m2/s, the MPPT efficiency reported by the PV simulator with high-speed linear interpolation function has a large error
To solve this problem, we need to select an appropriate IV curve update rate and measurement time window. For example, the AMETEK ELGAR PV simulator allows users to disable the instrument's automatic interpolation update of the IV curve 128 times per second, and enable the software-controlled method of updating the IV curve every 100 milliseconds. The software also operates the output power readback during this period, so that the current output power measurement and IV curve update synchronization can be ensured. In this way, the IV curve update rate is 10 times per second, which can reduce the power jump supplied to the inverter and the difference between the supply energy and the ideal situation to the order of 1%. It is undoubtedly the best photovoltaic simulator on the market. The following Figure 5 shows the test results after adopting this method. We can see that the red track representing the actual output power measurement result matches the blue track representing the ideal Pmp change very well. Figure 6 is a diagram of the test results over a longer period of time, including two situations of irradiance decrease and increase. It shows that the current inverter can adapt very well to this 1000W/m2 irradiance change rate and maintain an MPPT efficiency of more than 99%.
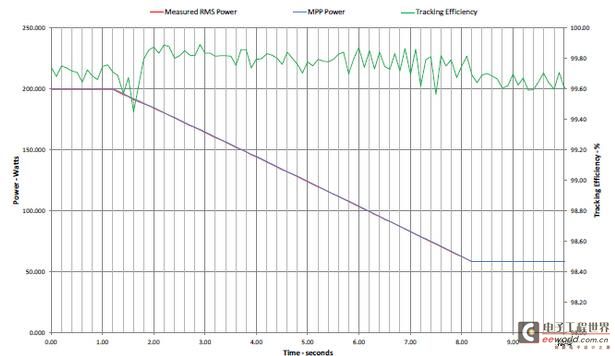
Figure 5 MPPT efficiency reported by the PV simulator with the software’s 10 times/second linear interpolation function enabled when the irradiance decreases linearly at 100W/m2/s
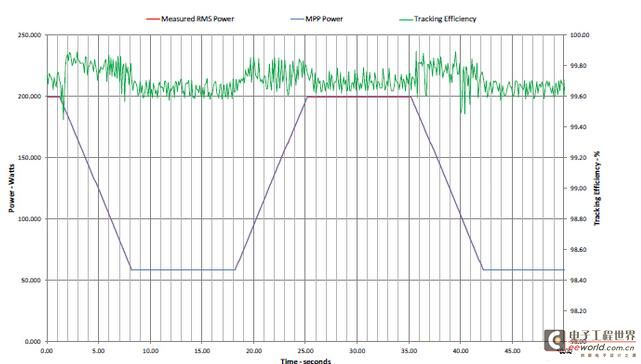
Figure 6 MPPT reported by the PV simulator with the software’s 10 times/second linear interpolation function enabled when the irradiance is linearly reduced for a longer period of time at 100 W/m2/s
In summary, when we need to simulate dynamic weather conditions in the laboratory, we need to be able to build or load various complex weather conditions and typical test modes defined by international standards. The time resolution of the constructed weather documents reaches the second level, and the actual IV curve update rate needs to be faster (such as 10 times per second) to meet the requirements of smooth changes and compliance with actual conditions. At the same time, when the IV curve is updated at a high speed, it is also necessary to ensure the synchronization of the output sampling data. Only in this way can we obtain sufficiently accurate and reliable test results.
Previous article:Design of energy-saving street lamps using sunlight and rainwater
Next article:Analysis of energy conversion of solar LED lighting
- MathWorks and NXP Collaborate to Launch Model-Based Design Toolbox for Battery Management Systems
- STMicroelectronics' advanced galvanically isolated gate driver STGAP3S provides flexible protection for IGBTs and SiC MOSFETs
- New diaphragm-free solid-state lithium battery technology is launched: the distance between the positive and negative electrodes is less than 0.000001 meters
- [“Source” Observe the Autumn Series] Application and testing of the next generation of semiconductor gallium oxide device photodetectors
- 采用自主设计封装,绝缘电阻显著提高!ROHM开发出更高电压xEV系统的SiC肖特基势垒二极管
- Will GaN replace SiC? PI's disruptive 1700V InnoMux2 is here to demonstrate
- From Isolation to the Third and a Half Generation: Understanding Naxinwei's Gate Driver IC in One Article
- The appeal of 48 V technology: importance, benefits and key factors in system-level applications
- Important breakthrough in recycling of used lithium-ion batteries
- Innolux's intelligent steer-by-wire solution makes cars smarter and safer
- 8051 MCU - Parity Check
- How to efficiently balance the sensitivity of tactile sensing interfaces
- What should I do if the servo motor shakes? What causes the servo motor to shake quickly?
- 【Brushless Motor】Analysis of three-phase BLDC motor and sharing of two popular development boards
- Midea Industrial Technology's subsidiaries Clou Electronics and Hekang New Energy jointly appeared at the Munich Battery Energy Storage Exhibition and Solar Energy Exhibition
- Guoxin Sichen | Application of ferroelectric memory PB85RS2MC in power battery management, with a capacity of 2M
- Analysis of common faults of frequency converter
- In a head-on competition with Qualcomm, what kind of cockpit products has Intel come up with?
- Dalian Rongke's all-vanadium liquid flow battery energy storage equipment industrialization project has entered the sprint stage before production
- Allegro MicroSystems Introduces Advanced Magnetic and Inductive Position Sensing Solutions at Electronica 2024
- Car key in the left hand, liveness detection radar in the right hand, UWB is imperative for cars!
- After a decade of rapid development, domestic CIS has entered the market
- Aegis Dagger Battery + Thor EM-i Super Hybrid, Geely New Energy has thrown out two "king bombs"
- A brief discussion on functional safety - fault, error, and failure
- In the smart car 2.0 cycle, these core industry chains are facing major opportunities!
- The United States and Japan are developing new batteries. CATL faces challenges? How should China's new energy battery industry respond?
- Murata launches high-precision 6-axis inertial sensor for automobiles
- Ford patents pre-charge alarm to help save costs and respond to emergencies
- New real-time microcontroller system from Texas Instruments enables smarter processing in automotive and industrial applications

 光伏发电技术及其应用 第2版 (魏学业,王立华,张俊红编著)


 京公网安备 11010802033920号