Phase noise, as an indicator of frequency controller and frequency source, is often tested by time and frequency professional metrology testers. This article focuses on the definition and test process of phase noise, gives actual test results, and points out some precautions in the test process of additional phase noise.
Definition of frequency source phase noise
The output signal of the frequency source can generally be expressed as:
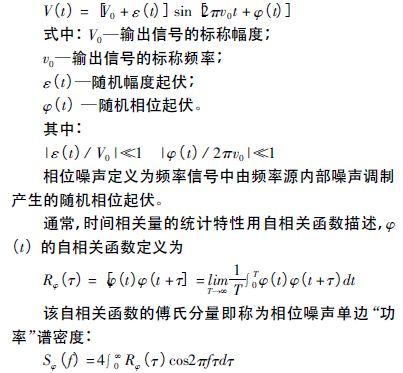
In phase noise measurement, the actual test result quantity is not the spectral density defined above, but the ratio of the signal modulation sideband power to the total signal power
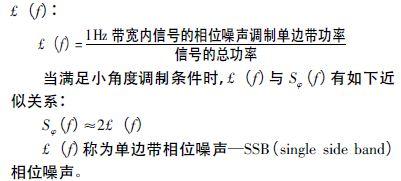
According to the definition recommended by the international community in the early years and the regulations of the National Institute of Standards and Technology NIST on relevant characteristic quantities in recent years, single-sideband phase noise is used as a frequency domain characterization quantity of frequency stability. Definition
of additional phase noise of frequency control device The
additional phase noise of frequency control device is also called two-port component noise or residual noise. When the signal passes through the two-port component, the noise is added to the signal in the form of linear addition or multiplication (modulation). Two-port components include amplifiers, dividers, filters, multipliers, etc.
Measurement of additional phase noise
The measurement of additional phase noise adopts the phase detector method.
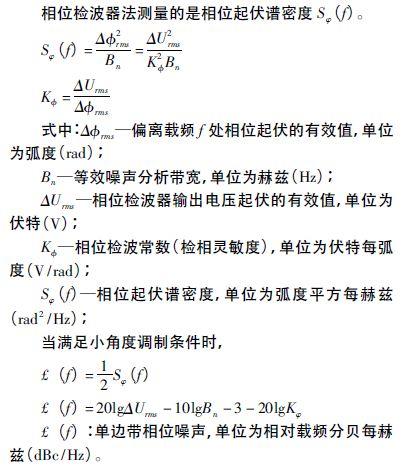
The phase detector method is the most widely used, highly sensitive, and wide-analysis-range phase noise measurement method. It is named because the phase detector is used to convert the phase fluctuation of the signal into voltage fluctuations, and then Sφ (f) is measured by a spectrum analyzer. Because this method utilizes the characteristic of the phase detector being sensitive to the signal phase when the two input signals are at a 90° phase difference, it is also called the orthogonal phase detection method. Because this method must have a reference frequency source, it is also called the dual-source method or active method. This measurement method is used to measure high-stability, low-noise precision frequency sources, such as atomic frequency standards, high-stability crystal oscillators, low-noise frequency synthesizers, phase-locked sources, and various frequency control devices. The
basic test principle of the phase detector method for testing additional phase noise is to divide the measured signal into two paths for phase detection. When the two signals are orthogonal and the electrical lengths are equal or approximately equal, the amplitude modulation noise and the source noise are fully suppressed, and the output of the phase detector reflects the additional phase noise of the measured frequency control device.
Measurement block diagram
The additional phase noise measurement block diagram is shown in Figure 1.

Figure 1 Additional phase noise measurement block diagram
Measurement steps
(1) Measurement preparation
Connect the instrument according to the diagram, power on and preheat. The preheating time is as required by the instrument manual. Note that the delay difference between the two signal paths from the power divider to the phase detector should be minimized, and a frequency source with low amplitude modulation noise should be selected.
(2) System calibration
System calibration is to measure the phase detection coefficient Kφ and determine the relationship between the phase fluctuation of the input signal and the output voltage fluctuation of the phase detector. There are two common methods for system calibration, the positive and negative DC peak method and the beat method.
Positive and negative DC peak method. Adjust the phase shifter and observe the orthogonal indicator to make the DC voltage output by the phase detector reach the positive peak value, represented by Umax, and then adjust the phase shifter to make the voltage reach the negative peak value, represented by Umin, then
Kφ=(Umax-Umin)/2beat
method. Use a power meter to measure the power at the reference input end; set the output frequency of the frequency synthesizer to f0 + fb (fb can be set to any low frequency less than 100kHz, typically 1kHz), and the output power is equal to the power at the reference input end. Replace the original reference signal with the reference input terminal, add a 50Ω terminal load to the end of the replaced signal path, and measure the voltage peak value of the beat signal fb output by the phase detector. The value of the phase detection constant K is equal to the voltage peak value of fb.
(3) Orthogonality and measurement
Adjust the phase shifter so that the DC voltmeter reading is zero, that is, the system is orthogonal, and use the spectrum analyzer to measure the sideband level value Pm at the deviation from the carrier frequency f.
(4) Correction of measurement data
The measured value Pm of the sideband level needs to be added with the following three correction factors:
Test result example
Figure 2 shows our actual test results of the solid-state power amplifier. The bottom curve in the figure is the background noise of the PN9000 phase noise test system, and the three curves above are the results of three repeated measurements.
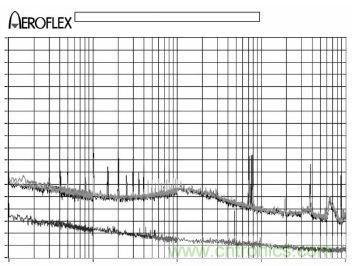
Figure 2 Additional phase noise measurement results example
Notes
(1) Under the premise of maintaining orthogonality, try to make the electrical lengths experienced by the two input signals of the phase detector equal. At this time, the noise of the source cancels each other in the phase detector, and the measured phase noise is the phase noise of the frequency control device under test.
(2) Currently, only the PN9000 phase noise test system with the additional phase noise option and the HP3048A phase noise test system have the additional phase noise test function.
(3) Before testing the additional phase noise of the frequency control device, it is generally necessary to measure the system background noise first to ensure that the test system is working properly.
(4) The phase noise of the frequency control device is generally better than the phase noise of the signal source. The phase noise of the solid-state power amplifier we tested is much better than the phase noise of the signal source.
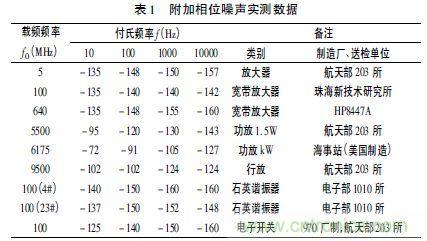
Table 1 Measured data of additional phase noise
Description of the degree of signal degradation
of the amplifier For the additional phase noise test of the amplifier, the author once tried to measure the phase noise of the signal source first, and then measure the phase noise of the signal source after connecting to the amplifier, and characterized the performance of the amplifier by the degree of degradation of the phase noise of the signal source caused by the amplifier, but the result showed almost no degradation of the signal source caused by the amplifier.
After analysis, the test results are true. This test method tests the sum of the phase noise of the amplifier and the signal source. The influence of the amplifier on the phase noise of the signal source can be given by the following formula:
e (dB) = 10lg[1 + 10-d/10]
d is the difference between the phase noise of the amplifier and the signal source. The degradation of the signal source phase noise by the amplifier is shown in Table 2.

Table 2 Phase noise degradation value
When the additional phase noise index of the amplifier is much better than the phase noise index of the signal source, this method is not suitable for measuring the additional phase noise of the amplifier.
Reference address:Attention! Experts explain additive phase noise testing technology
Definition of frequency source phase noise
The output signal of the frequency source can generally be expressed as:

In phase noise measurement, the actual test result quantity is not the spectral density defined above, but the ratio of the signal modulation sideband power to the total signal power

According to the definition recommended by the international community in the early years and the regulations of the National Institute of Standards and Technology NIST on relevant characteristic quantities in recent years, single-sideband phase noise is used as a frequency domain characterization quantity of frequency stability. Definition
of additional phase noise of frequency control device The
additional phase noise of frequency control device is also called two-port component noise or residual noise. When the signal passes through the two-port component, the noise is added to the signal in the form of linear addition or multiplication (modulation). Two-port components include amplifiers, dividers, filters, multipliers, etc.
Measurement of additional phase noise
The measurement of additional phase noise adopts the phase detector method.
The phase detector method is the most widely used, highly sensitive, and wide-analysis-range phase noise measurement method. It is named because the phase detector is used to convert the phase fluctuation of the signal into voltage fluctuations, and then Sφ (f) is measured by a spectrum analyzer. Because this method utilizes the characteristic of the phase detector being sensitive to the signal phase when the two input signals are at a 90° phase difference, it is also called the orthogonal phase detection method. Because this method must have a reference frequency source, it is also called the dual-source method or active method. This measurement method is used to measure high-stability, low-noise precision frequency sources, such as atomic frequency standards, high-stability crystal oscillators, low-noise frequency synthesizers, phase-locked sources, and various frequency control devices. The
basic test principle of the phase detector method for testing additional phase noise is to divide the measured signal into two paths for phase detection. When the two signals are orthogonal and the electrical lengths are equal or approximately equal, the amplitude modulation noise and the source noise are fully suppressed, and the output of the phase detector reflects the additional phase noise of the measured frequency control device.

Measurement block diagram
The additional phase noise measurement block diagram is shown in Figure 1.

Figure 1 Additional phase noise measurement block diagram
Measurement steps
(1) Measurement preparation
Connect the instrument according to the diagram, power on and preheat. The preheating time is as required by the instrument manual. Note that the delay difference between the two signal paths from the power divider to the phase detector should be minimized, and a frequency source with low amplitude modulation noise should be selected.
(2) System calibration
System calibration is to measure the phase detection coefficient Kφ and determine the relationship between the phase fluctuation of the input signal and the output voltage fluctuation of the phase detector. There are two common methods for system calibration, the positive and negative DC peak method and the beat method.
Positive and negative DC peak method. Adjust the phase shifter and observe the orthogonal indicator to make the DC voltage output by the phase detector reach the positive peak value, represented by Umax, and then adjust the phase shifter to make the voltage reach the negative peak value, represented by Umin, then
Kφ=(Umax-Umin)/2beat
method. Use a power meter to measure the power at the reference input end; set the output frequency of the frequency synthesizer to f0 + fb (fb can be set to any low frequency less than 100kHz, typically 1kHz), and the output power is equal to the power at the reference input end. Replace the original reference signal with the reference input terminal, add a 50Ω terminal load to the end of the replaced signal path, and measure the voltage peak value of the beat signal fb output by the phase detector. The value of the phase detection constant K is equal to the voltage peak value of fb.
(3) Orthogonality and measurement
Adjust the phase shifter so that the DC voltmeter reading is zero, that is, the system is orthogonal, and use the spectrum analyzer to measure the sideband level value Pm at the deviation from the carrier frequency f.
(4) Correction of measurement data
The measured value Pm of the sideband level needs to be added with the following three correction factors:

Test result example
Figure 2 shows our actual test results of the solid-state power amplifier. The bottom curve in the figure is the background noise of the PN9000 phase noise test system, and the three curves above are the results of three repeated measurements.

Figure 2 Additional phase noise measurement results example
Notes
(1) Under the premise of maintaining orthogonality, try to make the electrical lengths experienced by the two input signals of the phase detector equal. At this time, the noise of the source cancels each other in the phase detector, and the measured phase noise is the phase noise of the frequency control device under test.
(2) Currently, only the PN9000 phase noise test system with the additional phase noise option and the HP3048A phase noise test system have the additional phase noise test function.
(3) Before testing the additional phase noise of the frequency control device, it is generally necessary to measure the system background noise first to ensure that the test system is working properly.
(4) The phase noise of the frequency control device is generally better than the phase noise of the signal source. The phase noise of the solid-state power amplifier we tested is much better than the phase noise of the signal source.

Table 1 Measured data of additional phase noise
Description of the degree of signal degradation
of the amplifier For the additional phase noise test of the amplifier, the author once tried to measure the phase noise of the signal source first, and then measure the phase noise of the signal source after connecting to the amplifier, and characterized the performance of the amplifier by the degree of degradation of the phase noise of the signal source caused by the amplifier, but the result showed almost no degradation of the signal source caused by the amplifier.
After analysis, the test results are true. This test method tests the sum of the phase noise of the amplifier and the signal source. The influence of the amplifier on the phase noise of the signal source can be given by the following formula:
e (dB) = 10lg[1 + 10-d/10]
d is the difference between the phase noise of the amplifier and the signal source. The degradation of the signal source phase noise by the amplifier is shown in Table 2.

Table 2 Phase noise degradation value
When the additional phase noise index of the amplifier is much better than the phase noise index of the signal source, this method is not suitable for measuring the additional phase noise of the amplifier.
Previous article:Engineers must know: A trick to use a multimeter to measure the quality of the inverter!
Next article:The truth is out, the secrets of the oscilloscope revealed
Recommended Content
Latest Test Measurement Articles
- Keysight Technologies Helps Samsung Electronics Successfully Validate FiRa® 2.0 Safe Distance Measurement Test Case
- From probes to power supplies, Tektronix is leading the way in comprehensive innovation in power electronics testing
- Seizing the Opportunities in the Chinese Application Market: NI's Challenges and Answers
- Tektronix Launches Breakthrough Power Measurement Tools to Accelerate Innovation as Global Electrification Accelerates
- Not all oscilloscopes are created equal: Why ADCs and low noise floor matter
- Enable TekHSI high-speed interface function to accelerate the remote transmission of waveform data
- How to measure the quality of soft start thyristor
- How to use a multimeter to judge whether a soft starter is good or bad
- What are the advantages and disadvantages of non-contact temperature sensors?
MoreSelected Circuit Diagrams
MorePopular Articles
- Innolux's intelligent steer-by-wire solution makes cars smarter and safer
- 8051 MCU - Parity Check
- How to efficiently balance the sensitivity of tactile sensing interfaces
- What should I do if the servo motor shakes? What causes the servo motor to shake quickly?
- 【Brushless Motor】Analysis of three-phase BLDC motor and sharing of two popular development boards
- Midea Industrial Technology's subsidiaries Clou Electronics and Hekang New Energy jointly appeared at the Munich Battery Energy Storage Exhibition and Solar Energy Exhibition
- Guoxin Sichen | Application of ferroelectric memory PB85RS2MC in power battery management, with a capacity of 2M
- Analysis of common faults of frequency converter
- In a head-on competition with Qualcomm, what kind of cockpit products has Intel come up with?
- Dalian Rongke's all-vanadium liquid flow battery energy storage equipment industrialization project has entered the sprint stage before production
MoreDaily News
- Allegro MicroSystems Introduces Advanced Magnetic and Inductive Position Sensing Solutions at Electronica 2024
- Car key in the left hand, liveness detection radar in the right hand, UWB is imperative for cars!
- After a decade of rapid development, domestic CIS has entered the market
- Aegis Dagger Battery + Thor EM-i Super Hybrid, Geely New Energy has thrown out two "king bombs"
- A brief discussion on functional safety - fault, error, and failure
- In the smart car 2.0 cycle, these core industry chains are facing major opportunities!
- The United States and Japan are developing new batteries. CATL faces challenges? How should China's new energy battery industry respond?
- Murata launches high-precision 6-axis inertial sensor for automobiles
- Ford patents pre-charge alarm to help save costs and respond to emergencies
- New real-time microcontroller system from Texas Instruments enables smarter processing in automotive and industrial applications
Guess you like
- First day of work in 2021
- TL335x-EVM development board processor, FLASH, RAM, FRAM
- DSP2812 CMD detailed configuration example
- 【ESP32-Korvo Review】 01 Unboxing Experience
- Exposed! Another unfinished semiconductor project: defrauding state-owned land and refusing to return it! Using the name of chips to engage in real estate?
- How to configure C2000 to enter low power mode
- Basic concepts of amplifier circuits and three basic connections
- Does the material of the transformer determine the operating frequency of the transformer?
- CV2880 simple datasheet
- Washing machine problems

 ICCV2023 Paper Summary: Recognition: Categorization
 First Time, Every Time – Practical Tips for Phase- Locked Loop Design


 京公网安备 11010802033920号