Most of the functions that the transformer winding deformation tester can complete on the computer can be operated on the all-in-one machine. After checking that the test wiring is correct, start the power supply of the main measurement unit, and its power indicator should be displayed normally. .
The following introduces the functions of each area in the software interface.
1.
Enter the software, the upper left is the menu bar, there are three drop-down menus: "System", "View" and "Settings". The specific functions of each drop-down menu are introduced below.
System:

Start measurement, start the transformer test work, but generally some parameters need to be set before starting the test, so it is recommended to start the test process in the measurement area (detailed introduction below).
Stop measurement, stop the work being measured. If you need to exit the system, just turn off the power of the device.
View:
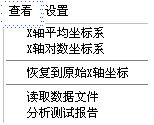
X-axis average coordinate system, this item is only valid when analyzing historical curves. After use, the frequency point distribution of the historical test curve adopts uniform distribution.
X-axis logarithmic coordinate system, this item is only valid when analyzing historical curves. After use, the frequency point distribution of the historical test curve adopts logarithmic distribution.
Restore to the original X-axis coordinates. This item is only valid when analyzing historical curves. When analyzing historical curves, you can zoom in on the curves and view them locally. After using this item, the curves will be restored to the original coordinate system.
Read data files. After selecting this item, a file selection dialog box will appear. You can read the historical data files stored in the instrument memory, view the curves or perform data analysis.
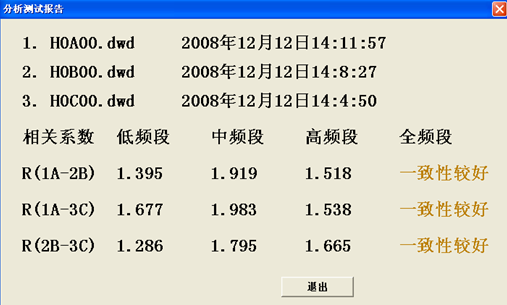
Analyze test reports. This item will analyze the selected data files and give analysis reports. This item is different from the PC test software and cannot print data analysis reports or output Word report files.
Settings:
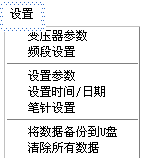
Transformer parameters. After selecting this item, a dialog box for each transformer parameter will be opened. After setting each parameter, press the "Confirm" key to save the input data, and press the "Cancel" key to abandon the input data.
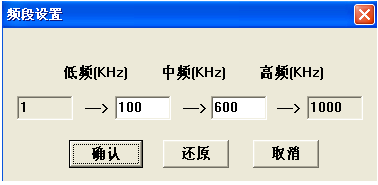
Frequency band settings. After selecting this item, a dialog box for scanning low, medium, and high frequency bands will be opened. After setting the range of each frequency band, press the "Confirm" key to save the input data, press the "Cancel" key to abandon the input data, and press the "Restore" key to restore to the default frequency band settings. The frequency band setting parameters of this item will only be reflected in the printed report.
Stylus setting: After selecting this item, you can set and calibrate the touch screen.
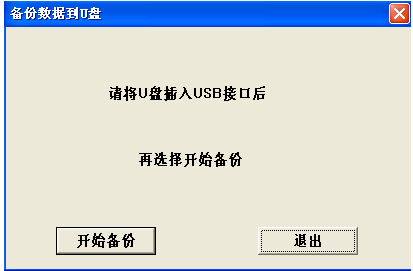
Back up data to USB flash drive: Select this item to save the measurement data files saved in the memory of the integrated machine to the USB flash drive. Before selecting to start the backup, please make sure that the USB flash drive has been inserted.
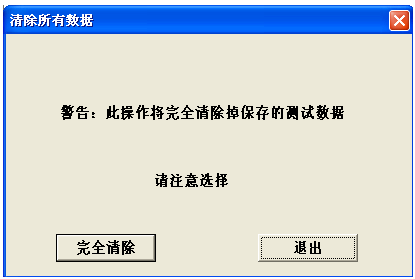
Clear all data: Select this item to clear all data saved in the memory of the integrated machine. Please note that you must confirm that the data has been backed up to the USB flash drive, and all data will be cleared.
2.
On the left are some parameters that need to be filled in when measuring the transformer. The "Transformer Parameters" button is the same as the transformer parameters in the menu. The "Start Measurement" button is used to test. During the test, you can select "Stop Measurement" to stop the test at any time. (Note: If the measurement is stopped during the test, the current measurement progress cannot be continued and the data cannot be saved.)
3.
The coordinate system in the center is the curve coordinate system, the X axis is the frequency, and the Y axis is the decibel. The historical curve and the measurement curve are displayed in this coordinate system. For specific operable functions, see the software test process.
4.
In the upper right of the curve coordinate system is the data display window, which displays frequency and decibel respectively. For detailed introduction, please refer to the software testing process.
5.
All other windows after the above introduction belong to the curve data file analysis management window. For detailed introduction of operation functions, please refer to the software testing process.
Reference address:All-in-one transformer winding deformation tester test software interface
The following introduces the functions of each area in the software interface.
1.
Enter the software, the upper left is the menu bar, there are three drop-down menus: "System", "View" and "Settings". The specific functions of each drop-down menu are introduced below.
System:

Start measurement, start the transformer test work, but generally some parameters need to be set before starting the test, so it is recommended to start the test process in the measurement area (detailed introduction below).
Stop measurement, stop the work being measured. If you need to exit the system, just turn off the power of the device.
View:

X-axis average coordinate system, this item is only valid when analyzing historical curves. After use, the frequency point distribution of the historical test curve adopts uniform distribution.
X-axis logarithmic coordinate system, this item is only valid when analyzing historical curves. After use, the frequency point distribution of the historical test curve adopts logarithmic distribution.
Restore to the original X-axis coordinates. This item is only valid when analyzing historical curves. When analyzing historical curves, you can zoom in on the curves and view them locally. After using this item, the curves will be restored to the original coordinate system.
Read data files. After selecting this item, a file selection dialog box will appear. You can read the historical data files stored in the instrument memory, view the curves or perform data analysis.
Analyze test reports. This item will analyze the selected data files and give analysis reports. This item is different from the PC test software and cannot print data analysis reports or output Word report files.

Settings:

Transformer parameters. After selecting this item, a dialog box for each transformer parameter will be opened. After setting each parameter, press the "Confirm" key to save the input data, and press the "Cancel" key to abandon the input data.
Frequency band settings. After selecting this item, a dialog box for scanning low, medium, and high frequency bands will be opened. After setting the range of each frequency band, press the "Confirm" key to save the input data, press the "Cancel" key to abandon the input data, and press the "Restore" key to restore to the default frequency band settings. The frequency band setting parameters of this item will only be reflected in the printed report.

Stylus setting: After selecting this item, you can set and calibrate the touch screen.
Back up data to USB flash drive: Select this item to save the measurement data files saved in the memory of the integrated machine to the USB flash drive. Before selecting to start the backup, please make sure that the USB flash drive has been inserted.

Clear all data: Select this item to clear all data saved in the memory of the integrated machine. Please note that you must confirm that the data has been backed up to the USB flash drive, and all data will be cleared.

2.
On the left are some parameters that need to be filled in when measuring the transformer. The "Transformer Parameters" button is the same as the transformer parameters in the menu. The "Start Measurement" button is used to test. During the test, you can select "Stop Measurement" to stop the test at any time. (Note: If the measurement is stopped during the test, the current measurement progress cannot be continued and the data cannot be saved.)
3.
The coordinate system in the center is the curve coordinate system, the X axis is the frequency, and the Y axis is the decibel. The historical curve and the measurement curve are displayed in this coordinate system. For specific operable functions, see the software test process.
4.
In the upper right of the curve coordinate system is the data display window, which displays frequency and decibel respectively. For detailed introduction, please refer to the software testing process.
5.
All other windows after the above introduction belong to the curve data file analysis management window. For detailed introduction of operation functions, please refer to the software testing process.
Previous article:Data curve analysis method of integrated winding deformation tester
Next article:How to install the USB driver of the winding deformation tester
Recommended Content
Latest Test Measurement Articles
- Keysight Technologies Helps Samsung Electronics Successfully Validate FiRa® 2.0 Safe Distance Measurement Test Case
- From probes to power supplies, Tektronix is leading the way in comprehensive innovation in power electronics testing
- Seizing the Opportunities in the Chinese Application Market: NI's Challenges and Answers
- Tektronix Launches Breakthrough Power Measurement Tools to Accelerate Innovation as Global Electrification Accelerates
- Not all oscilloscopes are created equal: Why ADCs and low noise floor matter
- Enable TekHSI high-speed interface function to accelerate the remote transmission of waveform data
- How to measure the quality of soft start thyristor
- How to use a multimeter to judge whether a soft starter is good or bad
- What are the advantages and disadvantages of non-contact temperature sensors?
MoreSelected Circuit Diagrams
MorePopular Articles
- Innolux's intelligent steer-by-wire solution makes cars smarter and safer
- 8051 MCU - Parity Check
- How to efficiently balance the sensitivity of tactile sensing interfaces
- What should I do if the servo motor shakes? What causes the servo motor to shake quickly?
- 【Brushless Motor】Analysis of three-phase BLDC motor and sharing of two popular development boards
- Midea Industrial Technology's subsidiaries Clou Electronics and Hekang New Energy jointly appeared at the Munich Battery Energy Storage Exhibition and Solar Energy Exhibition
- Guoxin Sichen | Application of ferroelectric memory PB85RS2MC in power battery management, with a capacity of 2M
- Analysis of common faults of frequency converter
- In a head-on competition with Qualcomm, what kind of cockpit products has Intel come up with?
- Dalian Rongke's all-vanadium liquid flow battery energy storage equipment industrialization project has entered the sprint stage before production
MoreDaily News
- Allegro MicroSystems Introduces Advanced Magnetic and Inductive Position Sensing Solutions at Electronica 2024
- Car key in the left hand, liveness detection radar in the right hand, UWB is imperative for cars!
- After a decade of rapid development, domestic CIS has entered the market
- Aegis Dagger Battery + Thor EM-i Super Hybrid, Geely New Energy has thrown out two "king bombs"
- A brief discussion on functional safety - fault, error, and failure
- In the smart car 2.0 cycle, these core industry chains are facing major opportunities!
- The United States and Japan are developing new batteries. CATL faces challenges? How should China's new energy battery industry respond?
- Murata launches high-precision 6-axis inertial sensor for automobiles
- Ford patents pre-charge alarm to help save costs and respond to emergencies
- New real-time microcontroller system from Texas Instruments enables smarter processing in automotive and industrial applications
Guess you like
- [Project source code] Determine the correspondence between the dedicated clock input pin of the FPGA and the PLL
- MCU + I2C communication response signal is abnormal
- 【NUCLEO-L552ZE Review】- 7 : EXTI - One unexpected thing after another
- Key scanning program based on FPGA
- Various causes of noise amplification
- Issues that should be paid attention to when drawing PCB diagrams from the perspective of welding
- How to design a battery tester for various battery sizes, voltages and form factors
- Can anyone help analyze the parameters of this DC-DC transformer?
- In the 5G era, IoT technology empowers smart healthcare
- 【TouchGFX Design】(2) Simple interface design

 Memory data packaging
 Feedback Control of Robot Driving Path


 京公网安备 11010802033920号