1.1 The role of triggering
Triggering is the most commonly used and effective tool for electronic engineers to locate specific circuit behaviors. By setting appropriate trigger conditions, engineers can effectively locate abnormal signals or signals of interest in the circuit.
Triggering has two main functions: first, isolating events of interest; second, synchronizing waveforms, that is, stably displaying the current waveform. The professional explanation is: set certain trigger conditions according to requirements, and when a waveform in the waveform stream meets this condition, the oscilloscope will capture the waveform and its adjacent parts in real time and display them stably on the screen.
When using an oscilloscope to locate abnormal problems, electronic engineers often use a test method that sets the trigger type to edge trigger and then uses the persistence display method to diagnose the circuit. Let's talk about the role of persistence. It can display historically accumulated signals, that is, it can continuously display the trajectory of the signal.
With the continuous development of oscilloscope technology, in addition to the commonly used edge trigger, the trigger modes also include slope, dwarf wave, window trigger, glitch, setup and hold time, mode, serial sequence, delay, video, NFC and other types.
1.2 Limitations of triggering
The trigger function that can isolate the event of interest, combined with the persistence display that can show the historical accumulated signal, these two are really a great combination! But is it enough? Can you really catch all abnormal signals?
Without rushing to answer the question, let's first imagine the following three situations:
First, it is impossible to confirm whether the abnormal signal exists. Usually, we will make a "bold assumption" based on the fault phenomenon of the circuit - suspect that there is a problem with a certain signal on the circuit board, and then "carefully verify" - set the oscilloscope to edge trigger and afterglow display, and then continue to observe for a few minutes before determining whether there is a problem with the waveform on the oscilloscope. This way of locating the problem is limited by the waveform capture rate of the oscilloscope. Therefore, everyone may suggest that a special trigger method should be used to locate it, but the problem is that when you don’t know whether the abnormal signal really exists, which trigger method should you use?
Second, the types of abnormal signals may be "strange and varied". Although modern oscilloscopes have many trigger types, they are limited after all. Have you ever encountered some special abnormal signals that you found cannot be triggered no matter which trigger type you use?
Third, there is a lot of noise superimposed on the triggered signal, which may cause false triggering. Every rising edge of the local noise signal may be mistaken as a rising edge by the trigger circuit, and every tiny pulse width of the local noise signal may be mistaken as a pulse width to be triggered by the trigger circuit. At this time, can you still trigger correctly?
When the above three situations occur, engineers will fall into such a dilemma: they cannot confirm whether there is an abnormal signal in the circuit, cannot set the trigger type of the abnormal signal, and cannot eliminate the false trigger caused by noise. When encountering the above problems, engineers may not be able to locate the problem by simply setting or changing the trigger conditions, and appear to be at a loss.
Next, we will discuss the above three issues.
Note: The oscilloscope used is the RTO1024 oscilloscope from R&S (lower left picture), and the measured signal is generated by the Golden Demo board from R&S (lower right picture).

2. Where did the abnormal signals go?
2.1 Thoughts triggered by the two experiments
For the first case, let's do two experiments.
Test conditions: The Golden Demo board generates a 10MHz square wave, and the oscilloscope is used to observe whether the square wave signal is abnormal.
Test 1: First, set the oscilloscope to 5ms edge delay trigger mode (as shown in Figure 1), and find that the square wave displayed by the oscilloscope is normal.
You may say that without the persistence display mode turned on, only the current waveform can be displayed, and the historical waveform cannot be accumulated, so the test is inaccurate. OK! We turned on the persistence display mode and waited for ten minutes, but still no abnormality was found in the waveform.
Someone may say that ten minutes is too short! Well, let's extend it for another half an hour. If that's not enough, then wait another hour. Still no abnormality is found. After this, can we conclude that there is no abnormality in the waveform? Don't rush to draw conclusions, let's take a look at Experiment 2.
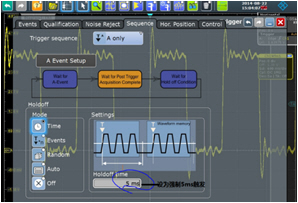
Figure 1 Setting the RTO1024 to 5ms edge delay trigger
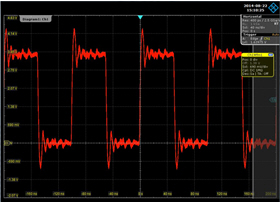
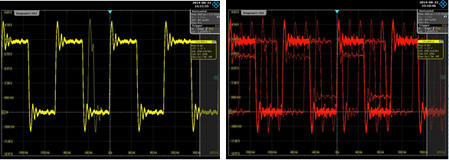
Figure 3 Abnormal signals emerge in endlessly
[page]
2.2 The key to confirming the existence of abnormal signals - waveform capture rate
2.2.1 Oscilloscope Working Principle
Before answering the question, let me briefly introduce the workflow of the oscilloscope. As shown in Figure 4, the workflow of the oscilloscope starts with triggering, followed by waveform acquisition, waveform storage, waveform processing, and finally waveform display, and so on. Triggering and acquisition belong to the effective capture time of the oscilloscope. Storage, processing and display belong to the blind area of the oscilloscope, that is, the dead time. During this period of time, the oscilloscope does not process the acquired data, but directly discards it. That is to say, only the waveform acquired in the acquisition stage will eventually be displayed on the oscilloscope screen.

Figure 4 Oscilloscope workflow
The waveform capture rate of an oscilloscope can be expressed by the following formula, which refers to the number of times the oscilloscope can perform cyclic capture per second. The waveform displayed after one capture process becomes one waveform.
Waveform capture rate = 1/capture cycle = 1/(effective capture time + dead time)
2.2.2 Impact of waveform capture rate
During the entire acquisition and capture process, the effective capture time is almost negligible compared to the dead time, so only by continuously reducing the dead time to increase the waveform capture rate can more signals be captured. As shown in Figure 5 below, when the waveform capture rate is 50,000wfms/s, the dead time accounts for 99.5%, while the effective capture time is only 0.5%. The abnormal waveforms in the dead time (the yellow area and the red circle show rare abnormal signals) cannot be observed by us, and naturally we cannot confirm whether there are abnormal signals in the current waveform. The waveform capture rate of R&S's RTO and RTE series oscilloscopes is as high as one million times per second, while other Windows-based oscilloscopes can generally only achieve a few thousand times per second, or even only a few hundred times.

Figure 5 Schematic diagram of dead time relative to effective capture time
Now we can answer the question at the end of Section 2.1. When the RTO1024 is set to the 5ms edge delay trigger mode, it means that the oscilloscope is triggered only once every 5ms, that is, the waveform capture rate is only 200 wfm/s, which is unable to capture abnormal signals. In the normal edge trigger mode, the waveform capture rate is as high as 1 million wfm/s, so it is easy to confirm the existence of abnormal waveforms.
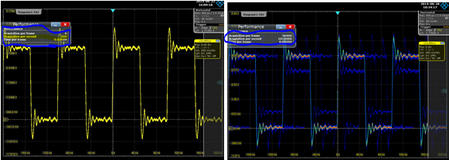
Figure 6 Comparison of waveform capture rates
3 MASK template test - triggering abnormal signals
Continuing with the above topic, using an oscilloscope with a waveform capture rate of up to one million times, we can easily determine that there is an abnormal signal in the waveform. However, how to trigger the abnormal signal in Figure 7? The abnormal signal is so complex that burrs, edge triggers, short pulses, delays, and other trigger types cannot effectively trigger it.
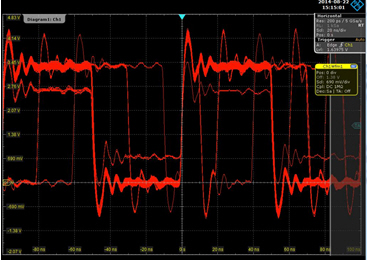
Figure 7 Complex abnormal signal
What should we do? Should we surrender and wait for death? The answer is of course "no", because the MASK test function of the R&S series oscilloscope effectively solves this problem.
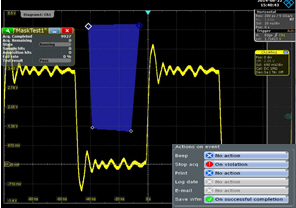
Figure 8 MASK test settings
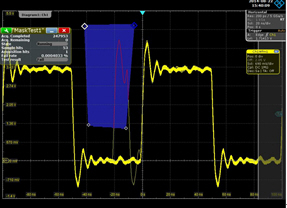
Figure 9 MASK template triggers abnormal signal
When using the MASK template test, we can arbitrarily draw MASK templates of different shapes within the range of interest in the time domain (as shown in the blue area in Figure 8. By the way, the RTO oscilloscope supports drawing up to 8 MASK templates), and then make corresponding settings for the MASK template (such as: buzzer warning, stop, automatic save waveform image, automatic save waveform data, etc.). As long as an abnormal signal touches the MASK template, the RTO oscilloscope will automatically perform the above actions and display the abnormal signal (as shown in the burr in the blue MASK template in Figure 9).
Although the types of abnormal signals are very complex, the MASK template test function can be used to trigger them very quickly, and subsequent actions can be automatically taken according to the MASK template settings, which is very user-friendly!
What's more advanced is that the R&S oscilloscope also supports MASK template testing in the frequency domain, capturing various abnormal signals in the frequency domain and taking corresponding actions based on the MASK template settings. This is a unique feature of the R&S oscilloscope.
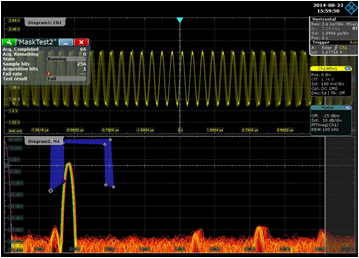
Figure 10 R&S oscilloscope’s unique frequency domain mask trigger function
[page]
4 How to resist false triggering caused by noise
4.1 False Triggering Caused by Noise
In today's society, the development of electronic products is changing with each passing day, which also makes our working environment increasingly complex, and there is a lot of electromagnetic noise. Do you know what kind of impact these noises will have on the triggering of the oscilloscope? Please read on.
Let's do another experiment. First, observe the waveform shown in Figure 11. How can there be a sine wave with rising and falling edges intertwined? Is it dazzled? Of course not. Rub your eyes and look again, and the result is the same. Is the signal originally like this? Of course not. The signal itself is a normal sine wave, and there is absolutely no "personality" split.
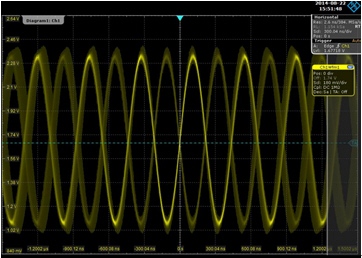
Figure 11 Sine wave double edge display
Next, keep pressing the "single trigger" button of the oscilloscope. Suddenly, you will find that the waveform is triggered on the falling edge (Figure 12). Then look at the oscilloscope settings. It is clearly triggered on the rising edge! Is there something wrong with the oscilloscope? The answer is naturally "no". Our oscilloscope is working properly!
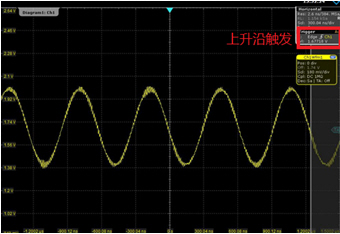
Figure 12 The waveform is incorrectly triggered on the falling edge
Are you confused and unable to believe your eyes after seeing this? I won't keep you in suspense. Let's zoom in on the edge of the waveform. What do you find? Yes, there are many noise signals superimposed on the edge of the sine wave, and the rising and falling edges of these noises have a certain voltage amplitude (Figure 13). When the oscilloscope triggers the rising edge of the noise on the falling edge of the sine wave, the abnormal signals shown in Figures 11 and 12 appear.
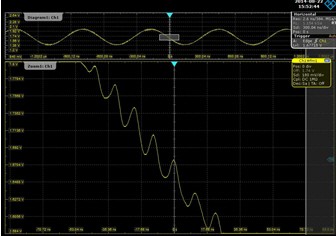
Figure 13: Noise signal superimposed on sine wave
Now it is clear that the problem is caused by these noises, but how to solve it? Please see Section 4.2!
4.2 Solution
If you use the R&S series oscilloscope, the solution is very simple. Just ignore the noise. We just need to open the "Noise Reject" interface in the trigger dialog box (Figure 14), and then adjust the hysteresis level until it is greater than the noise level. The double edge of the waveform disappears, and it will not be triggered on the falling edge (Figure 15).
The blue area across the entire screen shown in Figure 15 is the range of the noise hysteresis level. Any noise with a level less than this range will not be triggered. If you are sincere, please do not disturb!
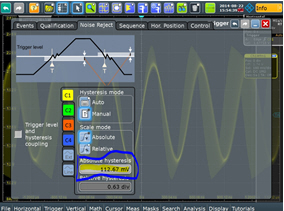
Figure 14 “Noise Reject” interface
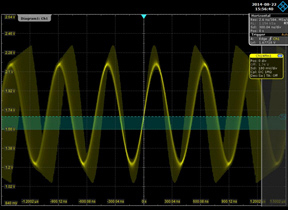
Figure 15 Noise hysteresis range, reducing trigger sensitivity
As can be seen from Section 1.1, triggering has two functions: isolating events of interest and synchronizing waveforms. The former requires trigger sensitivity, while the latter requires trigger stability. These two are undoubtedly contradictory: for stable triggering of noise signals, the trigger system is required to achieve a certain hysteresis around the trigger threshold (as shown in Figure 16); on the other hand, for small amplitude signals, a larger hysteresis will limit the sensitivity of the trigger system. The trigger hysteresis level of traditional oscilloscopes is a fixed value, so it is impossible to achieve a balance between the two.
R&S oscilloscopes use a new digital trigger architecture that implements an adjustable trigger hysteresis level, which can effectively solve the impact of noise signals on trigger stability and make it possible to balance trigger sensitivity and trigger stability.
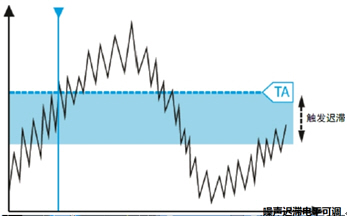
Figure 16 Trigger hysteresis enables stable triggering of noisy signals
5 Conclusion
For known signals, after we accurately set the trigger conditions, the signals we are interested in can be accurately and stably displayed in theory. If we cannot determine whether an abnormal signal exists, or the abnormal signal type is very complex, or the signal itself is interfered by noise, this will make electronic engineers at a loss and unable to select the correct trigger conditions. It can be seen that triggering is the most effective tool for locating problems, but it is not an effective means of discovering problems.
However, "a hero needs three helpers". The million waveform capture rate can quickly capture abnormal signals, the MASK template test can trigger any abnormal waveform, and the adjustable trigger level hysteresis method can ignore noise interference. These three features of the R&S oscilloscope are bound to complement each other with the trigger function. It is naturally more efficient to locate problems with the R&S oscilloscope.
"If you want to do your work well, you must first sharpen your tools." Such tools are undoubtedly the favorite of every electronic engineer!
Previous article:Getting Started with Oscilloscope Probe Basics (Part 2)
Next article:Triggering challenges and solutions
- Keysight Technologies Helps Samsung Electronics Successfully Validate FiRa® 2.0 Safe Distance Measurement Test Case
- From probes to power supplies, Tektronix is leading the way in comprehensive innovation in power electronics testing
- Seizing the Opportunities in the Chinese Application Market: NI's Challenges and Answers
- Tektronix Launches Breakthrough Power Measurement Tools to Accelerate Innovation as Global Electrification Accelerates
- Not all oscilloscopes are created equal: Why ADCs and low noise floor matter
- Enable TekHSI high-speed interface function to accelerate the remote transmission of waveform data
- How to measure the quality of soft start thyristor
- How to use a multimeter to judge whether a soft starter is good or bad
- What are the advantages and disadvantages of non-contact temperature sensors?
- Innolux's intelligent steer-by-wire solution makes cars smarter and safer
- 8051 MCU - Parity Check
- How to efficiently balance the sensitivity of tactile sensing interfaces
- What should I do if the servo motor shakes? What causes the servo motor to shake quickly?
- 【Brushless Motor】Analysis of three-phase BLDC motor and sharing of two popular development boards
- Midea Industrial Technology's subsidiaries Clou Electronics and Hekang New Energy jointly appeared at the Munich Battery Energy Storage Exhibition and Solar Energy Exhibition
- Guoxin Sichen | Application of ferroelectric memory PB85RS2MC in power battery management, with a capacity of 2M
- Analysis of common faults of frequency converter
- In a head-on competition with Qualcomm, what kind of cockpit products has Intel come up with?
- Dalian Rongke's all-vanadium liquid flow battery energy storage equipment industrialization project has entered the sprint stage before production
- Allegro MicroSystems Introduces Advanced Magnetic and Inductive Position Sensing Solutions at Electronica 2024
- Car key in the left hand, liveness detection radar in the right hand, UWB is imperative for cars!
- After a decade of rapid development, domestic CIS has entered the market
- Aegis Dagger Battery + Thor EM-i Super Hybrid, Geely New Energy has thrown out two "king bombs"
- A brief discussion on functional safety - fault, error, and failure
- In the smart car 2.0 cycle, these core industry chains are facing major opportunities!
- The United States and Japan are developing new batteries. CATL faces challenges? How should China's new energy battery industry respond?
- Murata launches high-precision 6-axis inertial sensor for automobiles
- Ford patents pre-charge alarm to help save costs and respond to emergencies
- New real-time microcontroller system from Texas Instruments enables smarter processing in automotive and industrial applications
- 【ST NUCLEO-H743ZI Review】(5) USB to Serial
- Questions about the calculation formula for the life of aluminum electrolytic capacitors
- Espressif ESP32-C5
- EEWORLD University ---- Haiwell IoT Terminal MQTT Protocol Application Video Tutorial
- [TI recommended course] #TI LED driver# RGB LED circuit design reference
- PNIRP-06V-S Properties Introduction
- [Synopsys IP Resources] Why HDCP 2.3 is required for high-definition large-screen displays
- AM335x Evaluation Board Quick Test (1)
- [TI mmWave Radar Review] Introduction to Sensor Management Module
- The relationship between FPGA memories

 ICCV2023 Paper Summary: Adversarial Attack and Defense
 AR and VR development practice


 京公网安备 11010802033920号