1 Introduction
Temperature monitoring of the isolating contacts of high-voltage switchgear has always been one of the major issues for safe operation of the power industry. However, since the contacts are in a strong electromagnetic field and high voltage environment, the current monitoring methods are all centered on how to achieve the system's resistance to strong electromagnetic field interference and high voltage isolation. The main methods include temperature measurement with temperature-sensitive paper, infrared temperature measurement, FP optical measurement, inductive power theft measurement, optical fiber transmission, and infrared wireless transmission. The fiber Bragg grating sensor integrates measurement and transmission, and uses light waves for measurement and transmission. It has the advantages of small size, light weight, low transmission loss, no electromagnetic field interference, and good insulation performance. Therefore, it is very suitable for the contact temperature measurement environment of high-voltage switchgear. Based on the above advantages, this paper proposes a contact temperature measurement scheme using a fiber Bragg grating temperature sensor, and uses reasonable installation technology to solve the influence of strain cross sensitivity.
2 Fiber Bragg Grating Sensor Principle
Fiber Bragg grating sensors can measure both temperature and strain, and both of these physical quantities can cause changes in the fiber Bragg grating wavelength.
The temperature sensing characteristics of fiber Bragg grating are caused by the thermo-optic effect and thermal expansion effect of fiber Bragg grating. The thermo-optic effect causes the change of the effective refractive index of the fiber Bragg grating, while the thermal expansion effect causes the grating period to change. When the temperature field in which the fiber Bragg grating sensor is located changes, it can be deduced that the effect of temperature on the change of Bragg wavelength is:
Where a is the thermal expansion coefficient of the optical fiber, which mainly causes the change of the grating period, and is taken as 5.5′10-7; x is the thermo-optic coefficient of the optical fiber, which mainly causes the change of the refractive index of the optical fiber, and is taken as 5.5′10-6. The strain characteristics of the fiber Bragg grating sensor are the result of the combined effects of the elasto-optic effect and the elastic effect. The elastic effect will change the grating period of the grating, and the elasto-optic effect will change the effective refractive index of the optical fiber. Its sensing characteristics can be expressed as [13].
Where Pe is the effective elastic coefficient of the optical fiber, Pe = 0.22. Because the fiber Bragg grating sensor can measure both temperature and strain, when measuring the temperature of the isolation contact of the high-voltage switch cabinet, it is necessary to find a way to shield the influence of the strain caused by the vibration of the switch cabinet on the temperature measurement accuracy. This is the strain cross sensitivity of the fiber Bragg grating sensor.
3. Contact temperature measurement system solution
3.1 Installation of Fiber Bragg Grating Sensor
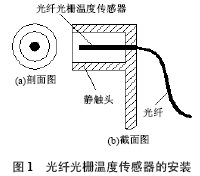
The circuit breaker of the high-voltage switch cabinet is divided into two parts: the mobile trolley and the switch cabinet. The high-voltage switch cabinet has a total of six contacts, which are distributed on the upper and lower sides of the A, B, and C phases. In order to ensure the reliability of the system, the temperature of the six contacts must be monitored simultaneously. As shown in equations (1) and (2), since the fiber grating sensor is sensitive to both temperature and strain, in order to ensure the accuracy of temperature measurement, the cross-sensitivity effect of strain must be shielded, that is, any strain generated during the opening and closing process of the circuit breaker should not be transmitted to the fiber grating sensor. This system is to shield the strain generated by the contact during the collision process by fixing the fiber grating temperature sensor on the static contact at one end. In addition, in order to ensure the uniformity of the fiber grating temperature sensor measuring the temperature of each point on the contact, the system makes full use of the middle space of the static contact and fixes the temperature sensor in the middle position of the static contact. Figure 1 is a schematic diagram of the installation of the sensor on a single static contact. When the moving contact and the static contact are opening and closing, strain is generated at the circumferential position of the static contact, while there is no strain at its center, so the strain cannot be transmitted to the fiber grating sensor. This installation scheme not only ensures the temperature measurement accuracy but also shields the strain cross-sensitivity caused by vibration.

3.2 Optical Path Multiplexing Solution
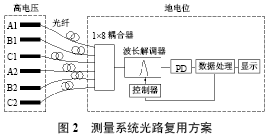
The simultaneous measurement of six fiber grating temperature sensors involves the multiplexing of optical paths. The multiplexing of fiber grating sensors can be done by wavelength division multiplexing (WDM), space division multiplexing (SDM) or time division multiplexing (TDM). This system uses space division multiplexing and wavelength division multiplexing. As shown in Figure 2, 1′8 couplers are used to realize space division multiplexing of sensors, which can avoid the disadvantages of using single wavelength division multiplexing, that is, multiple sensors are connected in series on one optical fiber, and when one sensor is damaged, it will affect the transmission of other sensor signals; at the same time, wavelength division multiplexing is used in the selection of sensor working wavelength to improve the measurement speed of the system, that is, when the wavelength is demodulated, one scanning cycle can be used to realize the simultaneous measurement of six sensors.
 [page]
In Figure 2, the six fiber Bragg grating temperature sensors of phases A, B, and C are on the high voltage side and are installed in the aperture of the static contact respectively, while the coupler, wavelength demodulator, controller, and data processing circuit are all on the ground potential side and installed in the control room. Long-distance optical fiber transmission is used to achieve insulation isolation on the high voltage side. A1, B1, C1, A2, B2, and C2 in the figure are fiber Bragg grating temperature sensors designed in this paper, which are respectively distributed on the upper and lower sides of the isolation contact A, B, and C. At room temperature, the wavelengths of the sensors are 1548.5nm, 1550.1nm, 1551.6nm, 1553.5nm, 1555.5nm, and 1557.1nm, respectively, with sensitivities of 0.011nm/℃, 0.013nm/℃, 0.011nm/℃, 0.010nm/℃, 0.011nm/℃, and 0.012nm/℃, and the measurement range is 0"110℃; the coupler is
The 1′8 coupler is composed of 7 3dB couplers. The wavelength demodulator uses a piezoelectric ceramic drive standard to achieve wavelength scanning. Its operating wavelength range is 1548"1558nm, covering all wavelength bands of 6 sensors when the temperature changes from 0"110℃. The controller realizes the scanning of the wavelength demodulator under the control of the data processor.
3.3 Contact temperature model
When the high-voltage switchgear is in operation, the contacts, busbars, current transformers, cabinets, etc. constitute multiple heat sources, and the high-voltage switchgear and its internal components constitute a complex thermal resistance network [14]. In this system, it is difficult to derive the mathematical relationship between the contact temperature rise and the fiber Bragg grating sensor temperature rise through theoretical deduction. Therefore, this paper establishes a mathematical model between them through experimental methods.
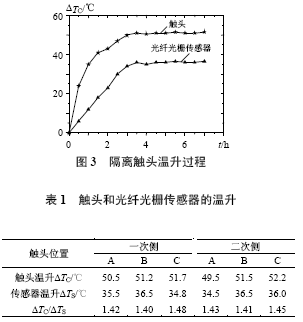
The temperature rise experiment was conducted on a 10kV high-voltage switchgear. During the experiment, the three-phase contacts were in normal contact, the rated working current was 1kA, and the room temperature was 25°C. Figure 3 is the temperature rise process curve of the upper isolation contact B phase. It can be seen that the temperature rise measured by the fiber grating sensor is slower than the actual temperature rise of the contact, but their changing trends are the same. The temperature field changes tend to stabilize after about 3 hours. The difference between the measured temperature and the actual temperature is due to the fact that the sensor uses a non-contact method to measure the temperature, which relies on the radiation of the static contact to transfer heat. Table 1 is its temperature rise measurement data.

It can be seen that when the switch cabinet contacts are in normal contact and the temperature changes are stable, the proportional relationship between the actual temperature rise value DTC of each contact and the corresponding sensor temperature rise value DTS is around 1.43. Taking the average value as the test result, the mathematical relationship between the actual temperature of the contact and the measured temperature of the sensor can be established as follows:
TC="K"(TS-T)+T (3)
Where K = "1".43; TS is the temperature value measured by the fiber Bragg grating temperature sensor; T is the ambient temperature of the high-voltage switch cabinet.
3.4 Analysis of the system's anti-electromagnetic interference
for
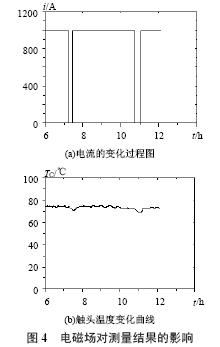
In order to test the anti-electromagnetic interference capability of the fiber Bragg grating sensor system, when the high-voltage switch cabinet is working at full load and the sensor measurement tends to be stable, the switch cabinet is suddenly powered off to detect the relationship between the temperature measurement result and the electromagnetic field [15-16], and the anti-electromagnetic interference capability experiment is realized. Figure 4 shows the temperature data measured on the B-phase contact on the primary side after the contact temperature rise tends to be stable. Two power outages were arranged during the test process. Figure 4 (a) is the current change process diagram, and Figure 4 (b) is the contact temperature change curve caused by the current change. It can be seen that when the busbar loses current, the contact temperature drops, but it quickly starts to rise after the power supply is restored. From the curve, it can be seen that the measured contact temperature responds to the sudden power outage and power supply, but the temperature rise and fall is gradual rather than sudden, indicating that the existence of the electromagnetic field has no effect on the transmission optical fiber and the fiber Bragg grating temperature sensor. If the existence of electromagnetic field makes the temperature displayed by the temperature measurement system higher or lower than the actual temperature, then once the current is lost in the switch cabinet busbar and the electromagnetic field disappears, the temperature display will immediately jump to the "actual value", but this jump phenomenon did not occur in the actual test. Therefore, it shows that the fiber Bragg grating contact temperature measurement system has a strong ability to resist electromagnetic interference.
4 Experimental Results
The fiber grating contact temperature measurement system was successfully tested on the 10kV high-voltage switchgear of the substation. Figure 5 is a 24-hour temperature monitoring record of the primary side B phase contact when the high-voltage switchgear is working in the rated load range of 70%, which reflects the change process of the contact temperature throughout the day. It can be seen from the figure that the contact temperature is the lowest from midnight to 6 am, which is partly due to the small power load and partly related to the low temperature; from 6 am, as the power load increases, the contact temperature also begins to rise, and the power load tends to be stable at 9 am, but due to the gradual increase in temperature, the contact temperature also begins to rise, and the temperature reaches the highest at 14 o'clock; from 14 o'clock to 18 o'clock, due to the decrease in temperature, the contact temperature gradually decreases; at the same time, after 18 o'clock, due to the increase in power load, the contact temperature begins to rise again, reaching the highest at 22 o'clock; thereafter, as the power load decreases, the contact temperature gradually decreases. Through the analysis of the 24-hour contact temperature records, it can be seen that the fiber Bragg grating contact temperature measurement system can work normally. Its recorded data correctly reflects the changing relationship between the contact temperature and the workload of the switch cabinet and the ambient air temperature, which shows that the fiber Bragg grating contact temperature measurement system is feasible.

5 Conclusion
This paper uses the advantages of fiber Bragg grating sensors, such as small size, strong anti-electromagnetic interference ability, and good insulation, to replace electronic sensors to realize temperature monitoring of the isolation contacts of high-voltage switch cabinets. This solution does not require complex insulation design, so it has the advantages of simplicity and reliability. In this solution, the strain cross-sensitivity effect of fiber Bragg grating temperature sensors is solved, and the space division multiplexing plus wavelength division multiplexing solution is adopted in the multiplexing of the optical path, which improves the reliability and real-time performance of the system. This system was tested on a 10kV high-voltage switch cabinet, and the system can operate normally, indicating that this solution is feasible.
Previous article:Research and design of ultrasonic distance measurement system
Next article:Design of frequency measurement module based on multi-channel phase-shifted clock
- Popular Resources
- Popular amplifiers
- Keysight Technologies Helps Samsung Electronics Successfully Validate FiRa® 2.0 Safe Distance Measurement Test Case
- From probes to power supplies, Tektronix is leading the way in comprehensive innovation in power electronics testing
- Seizing the Opportunities in the Chinese Application Market: NI's Challenges and Answers
- Tektronix Launches Breakthrough Power Measurement Tools to Accelerate Innovation as Global Electrification Accelerates
- Not all oscilloscopes are created equal: Why ADCs and low noise floor matter
- Enable TekHSI high-speed interface function to accelerate the remote transmission of waveform data
- How to measure the quality of soft start thyristor
- How to use a multimeter to judge whether a soft starter is good or bad
- What are the advantages and disadvantages of non-contact temperature sensors?
- Innolux's intelligent steer-by-wire solution makes cars smarter and safer
- 8051 MCU - Parity Check
- How to efficiently balance the sensitivity of tactile sensing interfaces
- What should I do if the servo motor shakes? What causes the servo motor to shake quickly?
- 【Brushless Motor】Analysis of three-phase BLDC motor and sharing of two popular development boards
- Midea Industrial Technology's subsidiaries Clou Electronics and Hekang New Energy jointly appeared at the Munich Battery Energy Storage Exhibition and Solar Energy Exhibition
- Guoxin Sichen | Application of ferroelectric memory PB85RS2MC in power battery management, with a capacity of 2M
- Analysis of common faults of frequency converter
- In a head-on competition with Qualcomm, what kind of cockpit products has Intel come up with?
- Dalian Rongke's all-vanadium liquid flow battery energy storage equipment industrialization project has entered the sprint stage before production
- Allegro MicroSystems Introduces Advanced Magnetic and Inductive Position Sensing Solutions at Electronica 2024
- Car key in the left hand, liveness detection radar in the right hand, UWB is imperative for cars!
- After a decade of rapid development, domestic CIS has entered the market
- Aegis Dagger Battery + Thor EM-i Super Hybrid, Geely New Energy has thrown out two "king bombs"
- A brief discussion on functional safety - fault, error, and failure
- In the smart car 2.0 cycle, these core industry chains are facing major opportunities!
- The United States and Japan are developing new batteries. CATL faces challenges? How should China's new energy battery industry respond?
- Murata launches high-precision 6-axis inertial sensor for automobiles
- Ford patents pre-charge alarm to help save costs and respond to emergencies
- New real-time microcontroller system from Texas Instruments enables smarter processing in automotive and industrial applications
- Read the good book "Electronic Engineer Self-study Handbook" + Mastery Edition Overview
- The 555 timer only has a trigger signal and no RC circuit. What is the voltage level at the output?
- How are the results of CST PCB simulation displayed?
- Arrow Live: Focus on "TI FPD-Link III Automotive Chipset", the ideal solution for automotive video transmission
- Application of “C2000+TMS570” dual-chip solution in automotive electric drive functional safety
- A complete list of filter circuits, save it for future use!
- BLDC brushless motor driver
- AD621 and AD620
- Introduction to the conventional methods and shortcut keys for drawing schematics in KiCad
- When a differential op amp is used as a voltage detector for a battery in a battery pack, what is the output voltage expression? Virtual short: V+=v- ...

 ST BMS kit solution Battery management system overall solution


 京公网安备 11010802033920号