introduction
Group delay is an important indicator for describing the phase-frequency characteristics of a transmission system. Its measurement methods can be roughly divided into two categories: vector network method and modulation method. Modulation method is further divided into amplitude modulation (AM) and frequency modulation (FM). In actual use, FM is widely used because it has better anti-interference characteristics than AM. This article also uses the FM method.
Basic concept of group delay
The proposal of group delay is based on the description of the phase-frequency characteristics of the transmission system. It is the delay of the entire signal after the group signal passes through a linear or nonlinear network. Its mathematical expression is:
In the above formula, j (w) is the phase-frequency characteristic of the system, and ω is the angular frequency of the carrier signal.
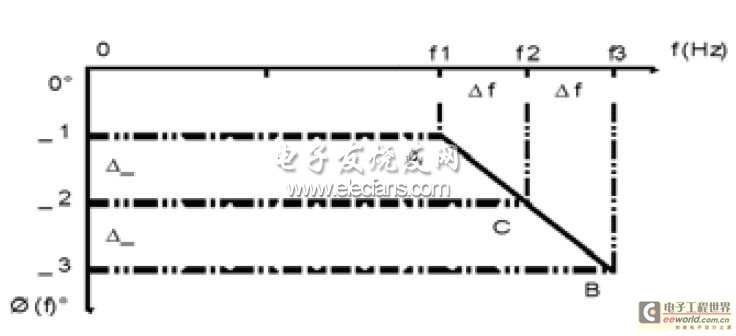
In a linear transmission network, the system phase-frequency characteristic is proportional to the frequency within the entire frequency band, and the group delay is a constant within the working frequency band. Such a system can transmit information without distortion, as shown in Figure 1.

Figure 1 Linear network phase-frequency curve
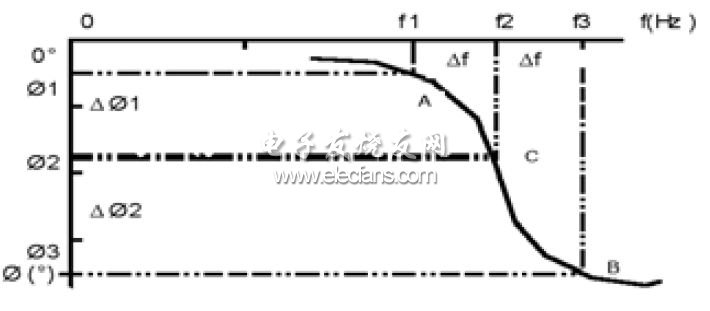
However, in practical applications, the system is not an ideal system, and different positions on the phase-frequency curve have different negative slopes, as shown in Figure 2.
.

Figure 2 Nonlinear network phase-frequency curve
The signal will be distorted after passing through the system shown in Figure 2. This system is usually called a nonlinear network.
Theoretical basis of vector network method
The test method of vector network is based on the definition of group delay. First, the phase-frequency characteristics of the transmission system are measured, and then the phase-frequency curve is differentiated to obtain the group delay. The test accuracy of this method is determined by the phase measurement accuracy and the size of the "aperture". The higher the phase measurement accuracy, the higher the group delay measurement accuracy. At the same time, the selection of the aperture is also very important. The so-called "aperture" is actually the denominator in the definition of group delay. Obviously, under a certain phase measurement accuracy, selecting a larger "aperture" can effectively improve the group delay measurement results. However, selecting an "aperture" that is too large actually violates the differential definition in the definition of group delay. According to the information provided by Agilent, the method for selecting the minimum aperture value is: the measured frequency range/(the number of measured frequency points-1), that is, selecting two adjacent points of the phase-frequency curve for differentiation; the maximum aperture shall not exceed 20% of the measured frequency range. At the same time, it should be noted that when selecting the "aperture", the phase difference between the two measured frequency points should not be greater than 180 degrees.
Theoretical basis of modulation method
When sine waves of different frequencies pass through the transmission system, their phases will change differently. What effect will this change have on the transmitted signal and the information it carries? Consider the input signal as:
.
Among them, fc is the center frequency of the carrier, and am(t) is the low-frequency modulation signal, which can modulate the carrier amplitude or frequency. The amplitude-frequency characteristics of the transmission system are:
Among them, G(f) is the amplitude-frequency characteristic of the transmission system, and Q(f) is the phase-frequency characteristic of the transmission system.
According to the formula derivation, the output of the synthetic signal is:
Where af is the amplitude corresponding to each frequency point, τc is the phase delay of the carrier, and τg is the negative slope corresponding to each frequency point on the phase-frequency curve, that is, the group delay at each frequency point.
By comparing (2) and (4), we can draw the following conclusion: the group delay of the modulated signal can be obtained by measuring the delay of the modulated signal. This conclusion allows us to measure the group delay of the transmission system using the modulation method.
It can also be understood from another perspective. For a signal, the truly useful part is the information it carries, and the information is contained in the modulated signal. If the group delay of the modulated signal within the working frequency band is a constant, then after the information passes through the transmission system, it will only produce a delay, and the information will not be distorted. On the contrary, within the working frequency band, the delay of the modulated signal fluctuates with the change of frequency, and the information carried will be distorted.
It should be pointed out that the modulation method in actual measurement is to measure the time difference between the modulated signal before and after it passes through the transmission network. In this way, after passing through the device under test, the quality of the demodulated low-frequency signal directly affects the measurement accuracy.[page]
System composition of several measurement methods
And the results comparison
This paper uses the vector network method and modulation method in the experiment. The modulation method uses three instruments as "time interval measuring instruments" for testing. The test process and results of the four measurement methods are explained below.
The DUT used here is a C-band frequency conversion system, with an input center frequency of 6224 GHz, a local oscillator of 2225 MHz, an output center frequency of 3999 GHz, and an operating bandwidth of 36 MHz. The mixer vector calibration was performed in the vector network method. In the frequency modulation method test, the down-conversion function of the spectrum analyzer E4448A was used to convert the output signal of the DUT to an intermediate frequency of 321.4 MHz, and then the FM signal was demodulated and measured at the intermediate frequency.
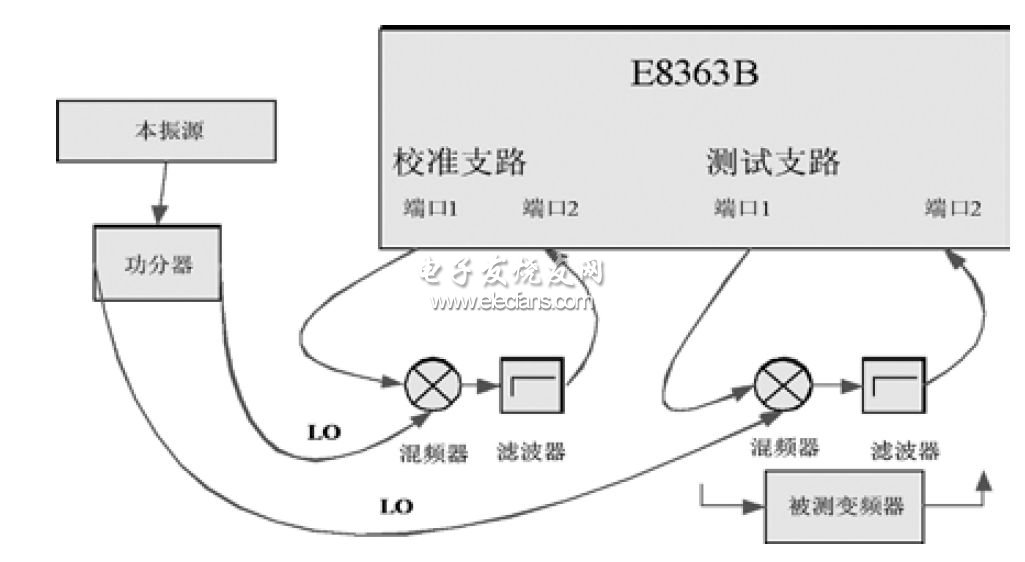
The vector network analyzer in the vector network method has vector calibration and frequency offset functions. We selected the E8363B analyzer and used two pairs of mixers + filters with the same frequency conversion relationship as the device under test. It is required that during the calibration and measurement process, two pairs of calibration mixers (for calibration) or mixers + the measured frequency converter (for testing), excitation source, local oscillator source, and vector network co-time base are required. Set the center frequency of the vector network to 3999MHz, the measurement bandwidth to 36MHz, and the number of measurement points to 101 points. After vector calibration, replace the measured frequency converter in the test branch and get the test results directly. The test block diagram is shown in Figure 3.

Figure 3 Vector network test block diagram
In the modulation method, the uplink excitation source is required to have an internal frequency modulation function. The low-frequency modulation signal is output from the "LF" port to one port of the "time interval meter". After the modulated carrier passes through the device under test, the signal is down-converted to an intermediate frequency signal using the down-conversion function of the spectrum analyzer. The low-frequency modulation signal is demodulated by the FM demodulator and sent to another port of the "time interval meter". The time difference between the two low-frequency signals is measured by the time interval meter, which is the group delay value of the frequency point. Within the working frequency band, the RF signal frequency of the uplink excitation source is changed with a certain step length to obtain the group delay change within the working bandwidth. The test block diagram is shown in Figure 4.

Figure 4 Modulation test block diagram
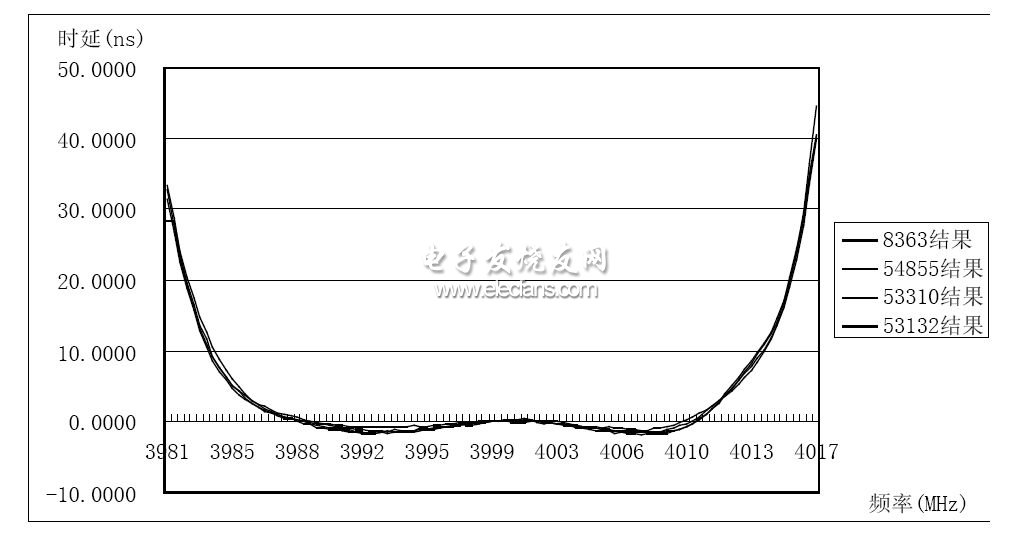
In the experiment, the modulation signal was set to 400kHz and the modulation frequency deviation was set to 1MHz in E8257D. The demodulated signal of "FM demodulator" was relatively stable, thus ensuring the measurement accuracy. The instruments used were oscilloscope 54855A, time interval analyzer 53310A, and frequency meter 53132A as time interval measuring instruments. The test results are shown in Figure 5.

Figure 5 Test results of four methods
The curve is the result after the center frequency is normalized. It can be seen that the test results of the four methods are very consistent.
Measurement analysis and actual measurement recommendations
As can be seen from FIG. 5 , several methods are feasible in actual use and can be selected according to specific circumstances.
When testing the frequency conversion system, the vector network method calculates the group delay from the differential phase-frequency characteristic curve of the device under test, which is relatively intuitive. Because of the accurate vector calibration, the absolute group delay test can be performed. At the same time, the vector network has high phase measurement accuracy and a small intermediate frequency bandwidth of the receiver (E8363B can reach 1Hz). In principle, it is not limited by the bandwidth of the device under test. This feature is very meaningful for measuring narrowband frequency converters. During the test, after correct calibration, the selection of the appropriate aperture will obtain stable and correct test results. However, in order to complete this calibration, special mixers and filters must be equipped for different frequency conversion systems, and the device under test must be able to lead out the time base signal, which makes the connection more complicated. In contrast, the new generation of PNA-X series vector networks do not require a common time base, which can simplify the link connection. It is recommended that in actual use, once the calibration branch and the test branch are built, the connection should be kept fixed and not shaken, so as to reduce errors. This must be ensured, especially in system-level testing. In addition, according to the performance of the selected mixer, a sufficiently large local oscillator signal and RF signal must be provided, and this must be ensured during calibration or testing. [page]
The demodulation quality of the "demodulator" in the modulation method is very important. The more stable the demodulated signal is, the higher the accuracy of the test result is. Usually, the demodulation quality is affected by four factors: the bandwidth of the frequency converter under test, the modulation index β, the modulation frequency fm and the modulation bandwidth BW.
On the one hand, to ensure the demodulation quality, the modulation bandwidth BW should be much smaller than the bandwidth of the inverter under test; on the other hand, the higher the modulation system gain GFM, the more favorable it is to the demodulation quality. From formula (5), it can be seen that the modulation system gain is proportional to the modulation bandwidth. In this way, the value of the modulation bandwidth BW should be considered comprehensively. We have given the recommended value of BW through experiments: the maximum value should not exceed 20% of the bandwidth of the inverter under test.
In addition, all modulation information is contained in the modulated signal, and selecting a point where the FM carrier is zero is also beneficial to the demodulation quality. Table 1 lists the following values of β when the carrier will have a zero point.

Table 1 Table of FM carrier zero point values
It can also be seen from formulas (6) and (7) that reducing the modulation index β and the modulation frequency fm can also reduce the modulation bandwidth BW. For broadband frequency conversion devices (MHz), there is a lot of room for selecting β and fm. For narrowband frequency conversion devices (kHz), in theory, the corresponding modulation frequency fm should be as small as possible. However, in practice, due to the influence of hardware performance during engineering implementation, fm is generally not less than 50kHz (empirical value). In this way, when β is 2.405, for narrowband frequency converters less than 500kHz, the hardware demodulation method is basically inaccurate. For narrowband frequency conversion devices, it is recommended to use software demodulation.
BW=2(?f+fm)=2fm(β+1) (6)
β=?f/ fm (7)
In order to perform accurate calibration in the modulation method, a standard frequency converter with the same frequency conversion performance as the device under test must be used. In practical applications, it is difficult to find such a standard device. Therefore, if you only care about the group delay change of the frequency converter under test within the working bandwidth, do not measure the absolute group delay, and do not calibrate the test branch, it is better to use this method. In this way, compared with the test bandwidth, the connecting cable, frequency converter, and demodulator can be considered as broadband devices, which will not affect the test results within the working bandwidth. Experiments have also proved this point.
Previous article:Design of a wide range and high stability crystal oscillator frequency stability test system
Next article:Design of a Ship Wake Detection System
- Keysight Technologies Helps Samsung Electronics Successfully Validate FiRa® 2.0 Safe Distance Measurement Test Case
- From probes to power supplies, Tektronix is leading the way in comprehensive innovation in power electronics testing
- Seizing the Opportunities in the Chinese Application Market: NI's Challenges and Answers
- Tektronix Launches Breakthrough Power Measurement Tools to Accelerate Innovation as Global Electrification Accelerates
- Not all oscilloscopes are created equal: Why ADCs and low noise floor matter
- Enable TekHSI high-speed interface function to accelerate the remote transmission of waveform data
- How to measure the quality of soft start thyristor
- How to use a multimeter to judge whether a soft starter is good or bad
- What are the advantages and disadvantages of non-contact temperature sensors?
- Innolux's intelligent steer-by-wire solution makes cars smarter and safer
- 8051 MCU - Parity Check
- How to efficiently balance the sensitivity of tactile sensing interfaces
- What should I do if the servo motor shakes? What causes the servo motor to shake quickly?
- 【Brushless Motor】Analysis of three-phase BLDC motor and sharing of two popular development boards
- Midea Industrial Technology's subsidiaries Clou Electronics and Hekang New Energy jointly appeared at the Munich Battery Energy Storage Exhibition and Solar Energy Exhibition
- Guoxin Sichen | Application of ferroelectric memory PB85RS2MC in power battery management, with a capacity of 2M
- Analysis of common faults of frequency converter
- In a head-on competition with Qualcomm, what kind of cockpit products has Intel come up with?
- Dalian Rongke's all-vanadium liquid flow battery energy storage equipment industrialization project has entered the sprint stage before production
- Allegro MicroSystems Introduces Advanced Magnetic and Inductive Position Sensing Solutions at Electronica 2024
- Car key in the left hand, liveness detection radar in the right hand, UWB is imperative for cars!
- After a decade of rapid development, domestic CIS has entered the market
- Aegis Dagger Battery + Thor EM-i Super Hybrid, Geely New Energy has thrown out two "king bombs"
- A brief discussion on functional safety - fault, error, and failure
- In the smart car 2.0 cycle, these core industry chains are facing major opportunities!
- The United States and Japan are developing new batteries. CATL faces challenges? How should China's new energy battery industry respond?
- Murata launches high-precision 6-axis inertial sensor for automobiles
- Ford patents pre-charge alarm to help save costs and respond to emergencies
- New real-time microcontroller system from Texas Instruments enables smarter processing in automotive and industrial applications
- Engineers, please take your seats. Keysight's metrology experts will give a lecture on electronic instrument metrology calibration knowledge and calibration cycle.
- What kind of circuit is this? Does anyone know how to analyze it?
- TMS320C5509A Study Notes - Pre-study Notes
- Could you help me check if this sentence is translated correctly?
- Msp430f149 programming interrupt processing function
- Python Notes for Professionals book
- Design of low voltage SRAM unit circuit based on 28nm process
- ~\(≧▽≦)/~A new board just arrived today, you know~
- When a diode is connected in series with a resistor and a voltage is applied across its terminals, how do I calculate the current value?
- SparkRoad Review (8) - VGA Test

 New Architectures for Radio-Frequency DC–DC Power Conversion


 京公网安备 11010802033920号