The oscilloscope is an electronic measuring instrument with a wide range of uses. It can transform invisible electrical signals into visible graphs, making it easier for people to study the changing process of various electrical phenomena. The oscilloscope can be used to observe the waveform curves of various signal amplitudes changing over time, and it can also be used to test various electrical quantities, such as voltage, current, frequency, phase difference, amplitude modulation, etc. In a broader sense, an oscilloscope is a display instrument that can reflect the XY coordinate graph of any two parameters that are related to each other. Oscilloscopes are not only used in laboratories, but have also become an indispensable auxiliary tool in the information age. Using oscilloscopes to detect and analyze signals in the circuits of electronic products can greatly improve the efficiency of maintenance. Understanding and mastering the oscilloscope principle of the oscilloscope is the premise for solving these problems, but most students find it difficult to understand this. The literature uses the hourglass pendulum motion experiment to simplify the oscilloscope principle by analogy, solving the problem of the display principle of the sine wave voltage; the literature discusses the relationship between the displayed waveform on the oscilloscope screen and the law of electronic motion, and the waveform period and the scanning voltage period, but both methods have shortcomings and need to be improved.
1 Structure of oscilloscope
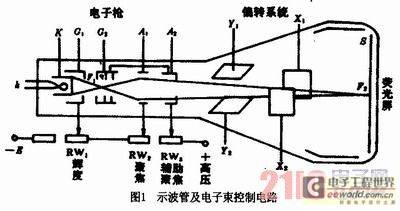
tube The oscilloscope tube is the core component of the oscilloscope, which consists of three parts: electron gun, deflection system and fluorescent screen (as shown in Figure 1). The function of the electron gun is to emit electrons and form a very thin high-speed electron beam; the deflection system consists of two pairs of deflection plates in the horizontal (x) direction and the vertical (y) direction, and its function is to determine how the electron beam is deflected; the function of the fluorescent screen is to display the waveform of the deflected electrical signal. The oscilloscope principle of the oscilloscope tube can be explained by a vivid metaphor, that is, the electron gun is compared to a drawing pen, the pen tip is the high-speed electron beam, the electron deflection system is compared to the hand holding the pen, and the fluorescent screen is compared to the drawing paper. Then the oscilloscope principle can be compared to the hand holding the pen and drawing on the paper.

2 Comparison of two oscilloscope principle analysis methods
The literature uses the hourglass pendulum motion experiment to simplify the oscilloscope principle by analogy. When a sine waveform is displayed on the oscilloscope screen, the electron beam bombards the phosphor on the screen to form a sine wave; when the hourglass simulates the pendulum motion, it can also draw a sine curve on the cardboard. These two situations are similar in both waveform and principle. This analysis method is effective for analyzing the sine wave principle displayed by the oscilloscope, and it is easy for students to understand, but it is invalid for analyzing the display of non-sinusoidal waveforms. In fact, the oscilloscope displays more than just sine waves, so other analysis methods are needed.
The literature discusses the relationship between the waveform displayed on the oscilloscope screen and the law of electron motion, the waveform period and the scanning voltage period, and applies the knowledge of force and motion in physics to analyze the oscilloscope principle. Although this method is difficult to understand, it can analyze the oscilloscope principle of all waveforms. However, the literature does not point out the key point of this method, that is, the number of electrons is large, and the electrons (actually electron beams) studied at different times are different; the other is that the speed of electrons is very fast, and the time it takes to pass through the deflection system is very short. The deflection voltage can be regarded as constant at the moment when each electron passes through the deflection system. Only by pointing out these two points, when the law of electron motion is selected to analyze and display the waveform, students will not only analyze the motion trajectory of a certain electron. In this way, it is easier to understand the law of electron motion: the distance that the electron in the electron beam deviates from the axis
![]()
KE is a constant related to the geometric size of the deflection system, U is the voltage at both ends of the deflection plate, and UA is the acceleration voltage of the accelerating electrode in the electron gun. Therefore, when UA is constant, the larger the deflection voltage, the greater the deflection distance of the electron is proportional to the deflection voltage; it is also easier to understand the oscilloscope principle derived from the law of electron motion.
3 Analysis method of arbitrary waveform formation principle
The electrons in the oscilloscope have three-dimensional motion, that is, the horizontal motion caused by the voltage on the horizontal deflection plate (x direction), the vertical motion caused by the voltage on the vertical deflection plate (y direction), and the motion perpendicular to the fluorescent screen (z direction). In fact, the electrons hitting the screen are the result of the synthesis of three sub-movements. Since the figure on the screen is analyzed, that is, the figure on the plane, the movement along the z direction can be ignored. Since the electrons studied at different times are different, and the deflection voltage can be regarded as constant at the moment when each electron passes through the deflection system, the analysis method of the arbitrary waveform formation principle can be obtained from formula (1) as follows:
(1) Adjust the oscilloscope knob so that the voltage on the y deflection plate and the x deflection plate are both zero, and the light spot is at the center of the screen;
(2) According to the characteristics of the voltage waveform on the y deflection plate, take multiple special points of the voltage waveform on the y deflection plate and the x deflection plate according to time;
(3) Determine the voltage on the y deflection plate and the x deflection plate at a certain moment;
(4) Determine the deflection distance in the y direction and the x direction by formula
![]() (UA is a constant), and synthesize to obtain the position of the light spot on the screen at this moment;
(UA is a constant), and synthesize to obtain the position of the light spot on the screen at this moment;
(5) Determine the position of the light spot on the screen at the moment corresponding to each special point by the same method;
(6) Use the point (light spot) method to draw the waveform. [page]
4 Application of the analysis method of arbitrary waveform formation principle
4.1 Displaying waveforms that change over time
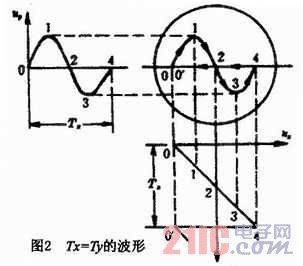
For example: if a sine wave voltage with a period of Ty is applied to the y deflection plate, and a sawtooth wave voltage with a period of Tx is applied to the x deflection plate, and Tx=Ty (as shown in Figure 2), the formation principle of the sine wave can be analyzed according to the method in the literature.

When t=t2, uy=0, ux=0, then the deflection distance of electron beam 2 in the y-axis direction is zero; in the x-axis direction, the deflection distance of electron beam 2 is also zero. After motion synthesis, it is projected to point 2 on the fluorescent screen, that is, the center of the fluorescent screen.
When t=t0, uy=0, ux=-Uxm, then the deflection distance of electron beam 0 in the y-axis direction is zero; in the negative direction of the x-axis, the deflection distance of electron beam 1 is the largest. After motion synthesis, it is assumed that it is projected to point 0 (or 0') on the fluorescent screen.
When t=t1, uy=Uym, ux=-1/2Uxm, then the deflection distance of electron beam 1 in the positive direction of the y-axis is the largest; in the negative direction of the x-axis, the deflection distance of electron beam 1 is 1/2 of the maximum deflection distance in the negative direction of the x-axis. After motion synthesis, it is assumed that it is projected to point 1 on the fluorescent screen.
When t=t3, uy=-Uym, ux=-1/2Uxm, then in the negative direction of the y-axis, the deflection distance of electron beam 3 is the maximum; in the positive direction of the x-axis, the deflection distance of electron beam 3 is 1/2 of the maximum deflection distance in the positive direction of the x-axis. After motion synthesis, it is assumed that it is shot at the point 3 position on the fluorescent screen.
When t=t4, uy=0, ux=Uxm, then in the y-axis direction, the deflection distance of electron beam 4 is zero; in the positive direction of the x-axis, the deflection distance of electron beam 4 is the maximum. After motion synthesis, it is shot
at the point 4 position on the fluorescent screen. In the next scanning cycle, the electron beam bombards the position of the fluorescent screen repeatedly, so that a complete sinusoidal waveform is formed.
4.2 Displaying the relationship between any two variables
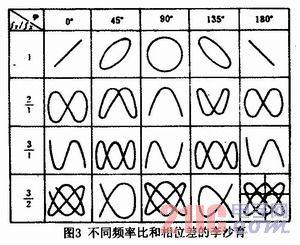
The figure displayed when a sinusoidal voltage is applied to both deflection plates of the oscilloscope is called a Lissajous figure. The shape of this figure depends on different frequency ratios and initial phase differences (as shown in Figure 3). For example, if the frequency ratio of the two sinusoidal signals is 1, the initial phases are the same, and the deflection distances in the x and y directions are the same, a straight line with an angle of 45° to the horizontal axis is drawn on the fluorescent screen; if the initial phases differ by 90° and the deflection distances in the x and y directions are the same, the figure drawn on the fluorescent screen is a circle.

Similarly, the formation principle of any waveform in Figure 3 can be analyzed according to the method in the literature.
5 Conclusion
This paper summarizes a method for analyzing the formation principle of arbitrary waveforms by comparing and analyzing the two oscilloscope principle analysis methods introduced in the literature, solving many doubts and difficult problems that students have had about the oscilloscope principle for many years.
Previous article:Importance of Probe Measurement Results
Next article:Research on Data Acquisition and Display of Ground Penetrating Radar Signals
- Keysight Technologies Helps Samsung Electronics Successfully Validate FiRa® 2.0 Safe Distance Measurement Test Case
- From probes to power supplies, Tektronix is leading the way in comprehensive innovation in power electronics testing
- Seizing the Opportunities in the Chinese Application Market: NI's Challenges and Answers
- Tektronix Launches Breakthrough Power Measurement Tools to Accelerate Innovation as Global Electrification Accelerates
- Not all oscilloscopes are created equal: Why ADCs and low noise floor matter
- Enable TekHSI high-speed interface function to accelerate the remote transmission of waveform data
- How to measure the quality of soft start thyristor
- How to use a multimeter to judge whether a soft starter is good or bad
- What are the advantages and disadvantages of non-contact temperature sensors?
- Innolux's intelligent steer-by-wire solution makes cars smarter and safer
- 8051 MCU - Parity Check
- How to efficiently balance the sensitivity of tactile sensing interfaces
- What should I do if the servo motor shakes? What causes the servo motor to shake quickly?
- 【Brushless Motor】Analysis of three-phase BLDC motor and sharing of two popular development boards
- Midea Industrial Technology's subsidiaries Clou Electronics and Hekang New Energy jointly appeared at the Munich Battery Energy Storage Exhibition and Solar Energy Exhibition
- Guoxin Sichen | Application of ferroelectric memory PB85RS2MC in power battery management, with a capacity of 2M
- Analysis of common faults of frequency converter
- In a head-on competition with Qualcomm, what kind of cockpit products has Intel come up with?
- Dalian Rongke's all-vanadium liquid flow battery energy storage equipment industrialization project has entered the sprint stage before production
- Allegro MicroSystems Introduces Advanced Magnetic and Inductive Position Sensing Solutions at Electronica 2024
- Car key in the left hand, liveness detection radar in the right hand, UWB is imperative for cars!
- After a decade of rapid development, domestic CIS has entered the market
- Aegis Dagger Battery + Thor EM-i Super Hybrid, Geely New Energy has thrown out two "king bombs"
- A brief discussion on functional safety - fault, error, and failure
- In the smart car 2.0 cycle, these core industry chains are facing major opportunities!
- The United States and Japan are developing new batteries. CATL faces challenges? How should China's new energy battery industry respond?
- Murata launches high-precision 6-axis inertial sensor for automobiles
- Ford patents pre-charge alarm to help save costs and respond to emergencies
- New real-time microcontroller system from Texas Instruments enables smarter processing in automotive and industrial applications
- EK140P Linux-4.1.15 Test Manual
- EEWORLD University Hall----Live Replay: HARTING- How to quickly and cost-effectively install cables in electrical control cabinets
- Introduction to Machine Vision Technology
- 【RT-Thread Reading Notes】1. RT-Thread RTOS Preface
- I would like to ask about an EXCEL curve fitting formula. I cannot get the value of Y by substituting the values of X (0, 150, 300). The value of Y is not correct.
- EEWORLD University ---- Sensors and Testing Technology
- The first question after the New Year is how dare I use this IGBT driving current.
- Bluetooth module interfaces
- Five factors to consider when designing a fixed wireless access (FWA) system
- Weak Bluetooth signal strength and excessive static power consumption of the product

 Multisim Circuit System Design and Simulation Tutorial
 Application of static fields


 京公网安备 11010802033920号