What is a virtual oscilloscope?
Virtual oscilloscopes use high-performance modular hardware combined with efficient and flexible software to complete various test, measurement and automation applications. Virtual instrument technology (VI) uses high-performance modular hardware combined with efficient and flexible software to complete various test, measurement and automation applications. Flexible and efficient software can help you create a completely customized user interface, modular hardware can easily provide a full range of system integration, and standard hardware and software platforms can meet the needs of synchronization and timing applications.
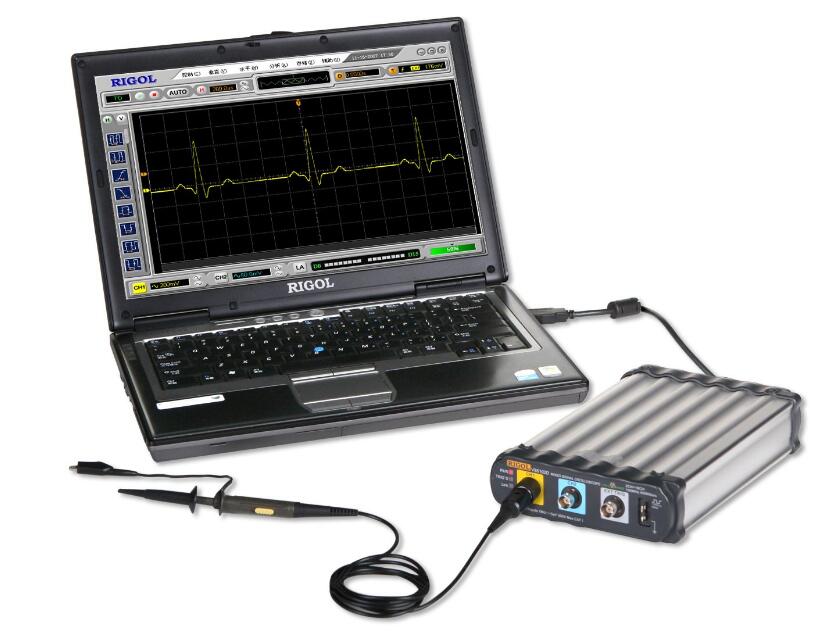
Composition of virtual oscilloscope
The components of a virtual oscilloscope mainly include three parts: signal acquisition and control, data analysis and processing, and display of measurement results.
Signal acquisition and control is a hardware platform composed of computers and instrument hardware to achieve signal acquisition, measurement, conversion and control;
Data analysis and processing is reflected in the fact that the virtual oscilloscope makes full use of the computer's storage and computing functions, and realizes the analysis and processing of input data signals through software;
The display of the measurement results of the virtual oscilloscope utilizes the computer's resources, such as display, memory, etc., to express and output the measurement results in a variety of ways. The computer can also be used to transmit and utilize data.
Features of Virtual Oscilloscope
(1) The widely used USB interface makes the interface between virtual instruments and computers more convenient and the communication speed higher;
(2) Use high-speed analog-to-digital conversion chips for high-speed sampling;
(3) Use high-performance single-chip microcomputer for control and high-speed large-capacity memory to save sampling data in real time, which improves the performance of the instrument;
(4) Use Labview language to design the host computer application, which can realize waveform display, as well as data analysis and processing.
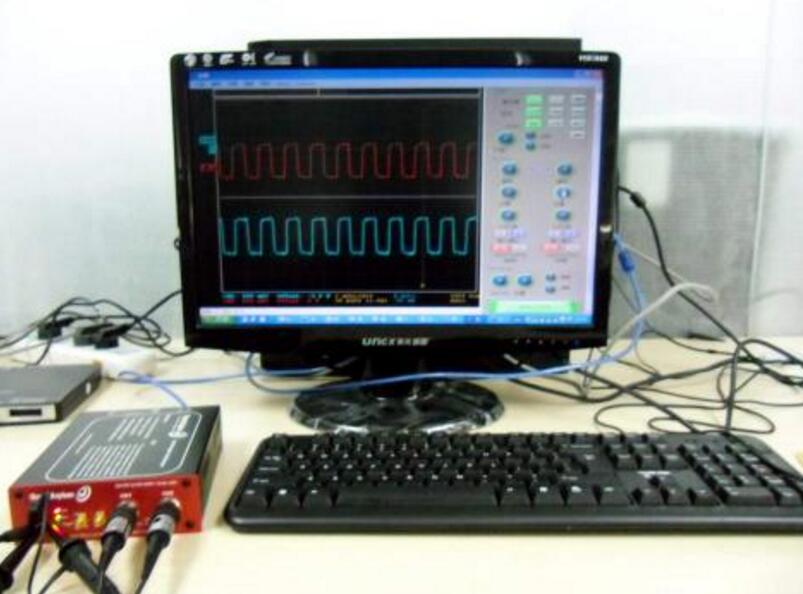
Virtual oscilloscope display mode
In order to meet the requirements of automatic control of different experiments, we provide four display modes of the oscilloscope.
(1) Oscilloscope time domain display mode
(2) Oscilloscope phase plane display (XY) mode
(3) The frequency characteristic display modes of the oscilloscope include logarithmic amplitude-frequency characteristic display, logarithmic phase-frequency characteristic display (Bode plot), amplitude-phase characteristic display mode (Nyquist plot), and time domain analysis (radian) display mode.
(4) Computer-controlled display mode of oscilloscope
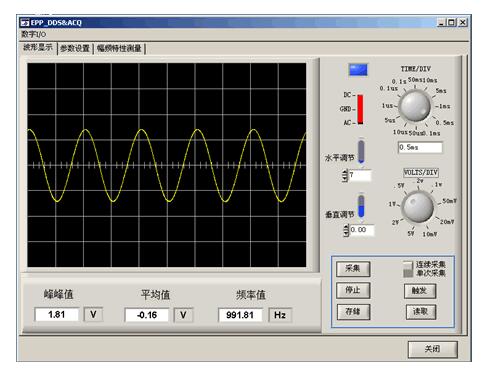
Use of Virtual Oscilloscope
1. Settings
Users can choose different oscilloscopes according to different requirements. The specific setting methods are as follows:
General usage of oscilloscope: Run LABACT program, select the 'Single-trace oscilloscope' item or the 'Dual-trace oscilloscope' item in the 'Tools' column, and the interface will pop up directly. The frequency response of the 'Single-trace oscilloscope' item is higher than that of the 'Dual-trace oscilloscope' item, and 6500 points per second can be observed; the 'Dual-trace oscilloscope' item can only observe 3200 points per second. Click Start to use it as a general oscilloscope.
Experimental use: Run the LABACT program, select the corresponding experimental project under the 'Automatic Control/Microcomputer Control/Control System' menu, and the virtual oscilloscope interface will pop up. Click Start to use the CH1 and CH2 hole measurement waveforms of the virtual oscilloscope (B3) unit of this experimental machine.
2. Use of Oscilloscope
1. Oscilloscope time domain display
The time domain display of the oscilloscope means that the X axis in the display interface is time t, and the Y axis is voltage U. See Figure 2-1 for the time domain display operation interface of the oscilloscope. As long as you click Start, the oscilloscope will run. At this time, you can use (CH1) and (CH2) on the experimental machine to collect and observe the waveform. CH1 and CH2 each have an input range selection switch. When the input voltage is less than -5v--+5v, the &TImes;1 gear should be selected.
Note: When using this virtual oscilloscope to collect and observe waveforms, if the input range selection switch is set to gear 1, the input voltage must be within the range of -5v--+5v. If it is greater than this input range, gear 5 should be selected (indicating that the input signal is attenuated 5 times before entering the oscilloscope).
There is a "Display Mode" selection box at the bottom of the display interface, which provides two modes: oscilloscope and XY. When the time domain display mode is required, the oscilloscope mode option in the box should be selected (usually when the oscilloscope interface pops up, the default is oscilloscope mode).
After clicking Stop, the oscilloscope will stop running and you can perform waveform analysis and related measurements (only the waveform of the current experiment will be saved).
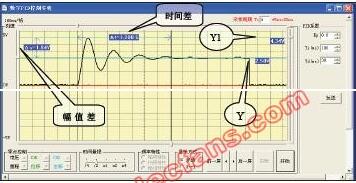
Figure 2-1 Virtual oscilloscope time domain display operation interface (digital PID control experiment curve)
(1) Signal amplitude measurement
There is a slider on each side of the display interface. The user clicks on the slider up and down to move to the point to be calibrated in the display interface. At this time, the data displayed on the yellow square on the far right of the slider is the amplitude of the current measurement point, see the 4.34V and 2.5V data display in Figure 2-1. The data displayed in the yellow square between the two sliders on the Y axis (on the left side of the display interface) is the amplitude difference between the two measurement points, see Δv=1.84V in Figure 2-1.
(2) Signal time measurement
a. Move the waveform from the start to the stop
The oscilloscope may have sampled multiple waveforms, so the user must first click 'Previous Screen' or 'Next Screen' at the bottom of the display interface to obtain the desired display screen, and then click the 'Fine Adjustment Button' in the middle to adjust the waveform to the best measurement state.
b. Compression/expansion waveform
There is a 'Time Range' selection box at the bottom of the display interface. In the box, '& TI mes;2' means that the waveform is compressed by 2 times, and '×4' means that the waveform is compressed by 4 times. This function is suitable for observing signals with low frequency and long period, such as observing the integral signal output with a large time constant; in the box, '/2' means that the waveform is magnified by 2 times, and '/4' means that the waveform is magnified by 4 times. This function is suitable for observing signals with higher frequency, such as observing the rise time of differential signal output and step output.
c. Measurement of signal time
When the signal is in the best measurement state on the display interface, the user can click and hold the upper and lower sliders on the display interface and move left and right to the point where the waveform needs to be calibrated. The data displayed in the yellow square between the two sliders on the X-axis is the time difference between the two calibration points on the X-axis, see Δt=1.200S in Figure 2-1.
2. Use of the phase plane display (XY) of the oscilloscope
In the 'Display Mode' selection box below the time domain display interface of the oscilloscope, if the user selects the 'X-Y' option, the virtual oscilloscope will provide the equivalent of the XY option in the real oscilloscope, which can realize the 'Phase Plane Analysis' experiment in the automatic control principle experiment.
When you want to observe the experimental results during the experiment, you should run the LabACT program, select the phase plane analysis experiment of the nonlinear system under the automatic control menu, and then select the typical nonlinear link, or the second-order nonlinear system, or the third-order nonlinear system. The corresponding virtual oscilloscope interface will pop up, and you can use the virtual oscilloscope of this experimental machine to observe the waveform. Make sure the experimental machine is online, and click Start to start the experiment.
Analyze waveform: After the complete waveform appears, click Stop to stop the operation and perform waveform analysis; or press the Refresh button to update the waveform.
Note: The waveform analysis must be stopped first. In the phase plane display interface, the same amplitude measurement and time measurement functions as in the time domain display can also be achieved.
In the phase plane analysis experiment of nonlinear experiment, if the user selects the 'Oscilloscope' option in the 'Display Mode' selection box, the oscilloscope will switch to the time domain display mode. In this way, the user can conveniently see the time domain display and phase plane display of the system on the same interface.
3. Use of computer controlled display of oscilloscope
The computer-controlled display mode of the oscilloscope can set and modify parameters on the oscilloscope display interface. This interface display mode is used for experiments such as PID algorithm, minimum beat control, Dalin algorithm, temperature control, etc. Note: The waveform analysis must be stopped first.
1) Minimum-shot control system experiment
When you want to observe the experimental results during the experiment, just run the LABACT program and select the minimum beat control system-ripple experiment project under the microcomputer control menu. The virtual oscilloscope interface will pop up. Make sure the experimental machine is online. Click Start to automatically load the corresponding source file. At this time, you can choose the CH1 and CH2 hole measurement waveforms of the virtual oscilloscope (B3) unit.
The experiment displays Ki, Pi, and seven control parameters in the "Calculation Formula" column at the bottom of the interface. There is a sampling period T at the top of the interface. After clicking Start, the following parameters will be set by default:
Previous article:Getting into the habit of using an oscilloscope will help you a lot
Next article:A Brief Introduction to Better Signal Integrity Metrics in Oscilloscopes
- Popular Resources
- Popular amplifiers
- Keysight Technologies Helps Samsung Electronics Successfully Validate FiRa® 2.0 Safe Distance Measurement Test Case
- From probes to power supplies, Tektronix is leading the way in comprehensive innovation in power electronics testing
- Seizing the Opportunities in the Chinese Application Market: NI's Challenges and Answers
- Tektronix Launches Breakthrough Power Measurement Tools to Accelerate Innovation as Global Electrification Accelerates
- Not all oscilloscopes are created equal: Why ADCs and low noise floor matter
- Enable TekHSI high-speed interface function to accelerate the remote transmission of waveform data
- How to measure the quality of soft start thyristor
- How to use a multimeter to judge whether a soft starter is good or bad
- What are the advantages and disadvantages of non-contact temperature sensors?
- Innolux's intelligent steer-by-wire solution makes cars smarter and safer
- 8051 MCU - Parity Check
- How to efficiently balance the sensitivity of tactile sensing interfaces
- What should I do if the servo motor shakes? What causes the servo motor to shake quickly?
- 【Brushless Motor】Analysis of three-phase BLDC motor and sharing of two popular development boards
- Midea Industrial Technology's subsidiaries Clou Electronics and Hekang New Energy jointly appeared at the Munich Battery Energy Storage Exhibition and Solar Energy Exhibition
- Guoxin Sichen | Application of ferroelectric memory PB85RS2MC in power battery management, with a capacity of 2M
- Analysis of common faults of frequency converter
- In a head-on competition with Qualcomm, what kind of cockpit products has Intel come up with?
- Dalian Rongke's all-vanadium liquid flow battery energy storage equipment industrialization project has entered the sprint stage before production
- Allegro MicroSystems Introduces Advanced Magnetic and Inductive Position Sensing Solutions at Electronica 2024
- Car key in the left hand, liveness detection radar in the right hand, UWB is imperative for cars!
- After a decade of rapid development, domestic CIS has entered the market
- Aegis Dagger Battery + Thor EM-i Super Hybrid, Geely New Energy has thrown out two "king bombs"
- A brief discussion on functional safety - fault, error, and failure
- In the smart car 2.0 cycle, these core industry chains are facing major opportunities!
- The United States and Japan are developing new batteries. CATL faces challenges? How should China's new energy battery industry respond?
- Murata launches high-precision 6-axis inertial sensor for automobiles
- Ford patents pre-charge alarm to help save costs and respond to emergencies
- New real-time microcontroller system from Texas Instruments enables smarter processing in automotive and industrial applications
- EEWORLD University ---- Tektronix uses mixed signal oscilloscope to explore the secrets of the bus
- Why choose 120Ω? The terminal resistance value recommended by the CAN standard
- Is there any sensor expert?
- About New Energy Vehicle Mode 2 IC-CPD Charging Gun Type A Leakage Current Sensor
- Help! What brand are the 2 UV sensors in the picture?
- Please tell me the pin definition of EPM7128S 100 pin. . . .
- BQ25120 Battery Management IC Problem Solving Sharing
- Difference between LOG_printf() and printf() in DSP
- What is the principle of this circuit?
- I want to know if this method is correct to predict the change in capacitance of chip capacitors due to temperature drift?


 Multi-port and shared memory architecture for high-performance ADAS SoCs


 京公网安备 11010802033920号