1 Principle of swept spectrum analyzer
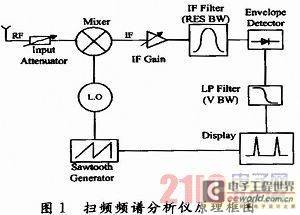
Spectrum analyzers can be divided into two categories from the implementation technology of spectrum testing: digital spectrum analyzers using Fourier transform (FFT) technology and analog spectrum analyzers using analog filters (including parallel filter spectrum analyzers and swept spectrum analyzers). Digital spectrum analyzers use numerical calculation methods to process signals of a certain time period, can provide frequency, amplitude and phase information, and can analyze both periodic and non-periodic signals. It is characterized by fast speed and high accuracy, and is suitable for analyzing narrowband signals. The sweeping spectrum analyzer of analog spectrum analyzer is the most common type at present. The superheterodyne method is generally used in the sweeping spectrum analysis. The sweeping spectrum analyzer can analyze stable and periodic signals, provide signal amplitude and frequency information, and is suitable for fast scanning tests with wide bandwidth. Agilent's ESA series economical spectrum analyzers and HP8563 are both sweeping spectrum analyzers. The simplified principle block diagram is shown in Figure 1. The sweeping spectrum analyzer is actually a multi-stage mixing structure. The core part of this analysis method is its mixer and intermediate frequency filter. The mixer downconverts the measured signal to the intermediate frequency, and then processes it at the intermediate frequency to obtain the amplitude. The local oscillator uses a swept oscillator. Its output signal and each frequency component in the measured signal are sequentially difference-converted in the mixer. The generated intermediate frequency signal passes through the intermediate frequency narrowband filter, is amplified and detected, and is added to the video amplifier as the vertical deflection signal of the oscilloscope, so that the vertical display on the screen is proportional to the amplitude of each frequency component. The frequency sweep of the local oscillator is controlled by the sawtooth voltage generated by the sawtooth wave sweep generator. The sawtooth wave voltage is also used as the horizontal scan of the oscilloscope, so that the horizontal display on the screen is proportional to the frequency.

2 Factors affecting the frequency resolution of spectrum analyzers
The frequency resolution of a spectrum analyzer is its ability to distinguish adjacent frequency components. Many signal tests require the spectrum analyzer to have a high frequency resolution. Only when the resolution of the spectrum analyzer is high enough can the characteristics of the signal be correctly reflected on the screen. The frequency resolution of a spectrum analyzer is related to the performance of its internal intermediate frequency filter and local oscillator. The type of intermediate frequency filter, 3 dB bandwidth, frequency selectivity, and the residual frequency modulation and local oscillator phase noise of the local oscillator will affect the frequency resolution of the spectrum analyzer.
2.1 The impact of intermediate frequency filter on frequency resolution
The function of the intermediate frequency filter is to distinguish signals of different frequencies. It is a key part of the spectrum analyzer. It is a narrowband filter with a fixed center frequency. Only by changing the frequency of the swept signal of the local oscillator can the frequency selection be achieved. If the frequency after mixing of the spectrum analyzer falls within the passband of the intermediate frequency filter, the frequency will be displayed on the display. If the frequency after mixing is not equal to the intermediate frequency, it will be blocked by the intermediate frequency filter. The shape of the ideal single-carrier signal displayed in the swept spectrum analyzer test is the frequency response shape of the filter. The shape of the intermediate frequency filter is defined by its bandwidth (3 dB or 6 dB) and frequency selectivity. Its 3 dB bandwidth and rectangular coefficient affect many key indicators of the spectrum analyzer, such as measurement resolution, measurement sensitivity, measurement speed and measurement accuracy.
2.1.1 Impact of resolution bandwidth on frequency resolution
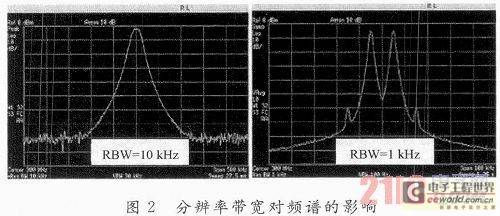
Resolution bandwidth (RES BW) is the 3 dB bandwidth of the intermediate frequency filter, which reflects the ability of the spectrum analyzer to distinguish equal-amplitude signals. When the frequency difference between two equal-amplitude signals is the 3 dB bandwidth of the intermediate frequency filter, the synthetic response curve still has two peaks, and the middle sinks by about 3 dB. They are considered to be distinguishable, so the 3 dB bandwidth of the intermediate frequency filter is called the resolution bandwidth (RES BW) of the spectrum analyzer. HP/AGILENT spectrum analyzers define the 3 dB bandwidth of the intermediate frequency filter as RESBW, and some companies define the 6 dB bandwidth as RES BW. The minimum resolution bandwidth of a spectrum analyzer reflects the grade of the spectrum analyzer. The economical type is 1 kHz to 5 MHz, the multi-functional mid-range type is 30 Hz to 5 MHz, and the high-end type is 1 Hz to 5 MHz. [page]

Conclusion: If the interval between the two signals is greater than or equal to the set resolution bandwidth RES BW, the two equal-amplitude signals can be distinguished. If it is less than the selected RES BW, the two signals cannot be distinguished. The smaller the RES BW of the spectrum analyzer, the higher its frequency resolution.
2.1.2 Effect of frequency selectivity on frequency resolution
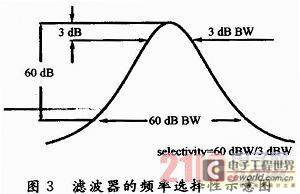
The frequency selectivity of the intermediate frequency filter is the ratio of the 60 dB bandwidth to the 3 dB bandwidth of the intermediate frequency filter, as shown in Figure 3. It reflects the ability of the spectrum analyzer to distinguish signals of unequal amplitude. For two signals with an amplitude difference of 60 dB, the interval must be at least half of the 60 dB bandwidth to distinguish the two signals, otherwise the small signal may be submerged in the skirt of the large signal. The frequency selectivity of the narrowband bandpass filter implemented by digital technology can reach 5:1, and the frequency selectivity of the analog filter can reach 15:1 or 11:1. Figure 3 is a schematic diagram of the frequency selectivity of the filter.

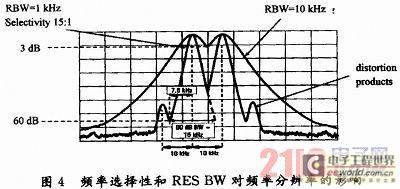
The following example illustrates the effect of different frequency resolution and frequency selectivity on the resolution of unequal amplitude signals. If the RES BW is 3 kHz and the filter frequency selectivity is 15:1, then the bandwidth of the filter down 60 dB is 45 kHz, and half of the 60 dB bandwidth is 22.5 kHz, so the -60 dBc signal 22.5 kHz away from the large signal can be detected. If it is switched to another narrowband filter with a RES BW of 1 kHz and a frequency selectivity of 15:1, then the bandwidth of the filter down 60 dB is 15 kHz, and half of the 60 dB bandwidth is 7.5 kHz, then the ~60 dBc signal 7.5 kHz away from the large signal can be detected. Or switch to another filter with a RES BW of 3 kHz and a frequency selectivity of 5:1, then the bandwidth of the filter down 60 dB is 45 kHz, and half of the 60 dB bandwidth is 7.5 kHz, then the -60 dBc signal 7.5 kHz away from the large signal can be detected. Figure 4 shows the spectrum analyzer measurement results when the frequency filter RES BW = 1 kHz and RES BW = 10 kHz with a frequency selectivity of 15:1. It can be seen that when RES BW = 1 kHz, a -60 dBc signal 7.5 kHz away from the large signal can be detected.

Conclusion: The smaller the frequency selectivity of a spectrum analyzer, the stronger its ability to resolve signals of unequal amplitude. However, the frequency selectivity of a spectrum analyzer is fixed, while the resolution bandwidth is variable. Therefore, when measuring tiny signals, the measurement effect can be achieved by narrowing the resolution bandwidth as much as possible and reducing the average display noise level.
Previous article:Design of a low-cost noise meter
Next article:Planning of multi-task scheduling mode for recorders
- Popular Resources
- Popular amplifiers
- Keysight Technologies Helps Samsung Electronics Successfully Validate FiRa® 2.0 Safe Distance Measurement Test Case
- From probes to power supplies, Tektronix is leading the way in comprehensive innovation in power electronics testing
- Seizing the Opportunities in the Chinese Application Market: NI's Challenges and Answers
- Tektronix Launches Breakthrough Power Measurement Tools to Accelerate Innovation as Global Electrification Accelerates
- Not all oscilloscopes are created equal: Why ADCs and low noise floor matter
- Enable TekHSI high-speed interface function to accelerate the remote transmission of waveform data
- How to measure the quality of soft start thyristor
- How to use a multimeter to judge whether a soft starter is good or bad
- What are the advantages and disadvantages of non-contact temperature sensors?
- Innolux's intelligent steer-by-wire solution makes cars smarter and safer
- 8051 MCU - Parity Check
- How to efficiently balance the sensitivity of tactile sensing interfaces
- What should I do if the servo motor shakes? What causes the servo motor to shake quickly?
- 【Brushless Motor】Analysis of three-phase BLDC motor and sharing of two popular development boards
- Midea Industrial Technology's subsidiaries Clou Electronics and Hekang New Energy jointly appeared at the Munich Battery Energy Storage Exhibition and Solar Energy Exhibition
- Guoxin Sichen | Application of ferroelectric memory PB85RS2MC in power battery management, with a capacity of 2M
- Analysis of common faults of frequency converter
- In a head-on competition with Qualcomm, what kind of cockpit products has Intel come up with?
- Dalian Rongke's all-vanadium liquid flow battery energy storage equipment industrialization project has entered the sprint stage before production
- Allegro MicroSystems Introduces Advanced Magnetic and Inductive Position Sensing Solutions at Electronica 2024
- Car key in the left hand, liveness detection radar in the right hand, UWB is imperative for cars!
- After a decade of rapid development, domestic CIS has entered the market
- Aegis Dagger Battery + Thor EM-i Super Hybrid, Geely New Energy has thrown out two "king bombs"
- A brief discussion on functional safety - fault, error, and failure
- In the smart car 2.0 cycle, these core industry chains are facing major opportunities!
- The United States and Japan are developing new batteries. CATL faces challenges? How should China's new energy battery industry respond?
- Murata launches high-precision 6-axis inertial sensor for automobiles
- Ford patents pre-charge alarm to help save costs and respond to emergencies
- New real-time microcontroller system from Texas Instruments enables smarter processing in automotive and industrial applications
- Schematic diagram of various application circuits of LM324
- [Voice and vision module based on ESP32S3]-The materials have not arrived yet, so use ESPcam to test QR code recognition first
- Circuit Schematic Analysis Method
- Hongmeng Development Board Neptune (Part 3) - Problems encountered in the development environment
- Live broadcast at 10:00 am today [Unlocking new possibilities of TI Sitara AM2x MCU in motor drive]
- 3.5mm audio interface type description
- Is wireless charging technology for new energy vehicles really not working?
- Introduction to flow principle in automatic monitoring system of oil and gas recovery in oil stations
- Op amp
- R8C uses RD timer and needs to use mov instruction to write trdstr register

 DESIGN OF SIGMA DELTA ADC FOR BIO SIGNAL (ECG) ACQUISTION


 京公网安备 11010802033920号